
Hosting Reviews Where Every Number Traces to a Test
No vendor-provided accounts. No sponsored placements. I buy every hosting plan with my own money, run load tests, measure TTFB, check CPU PassMark scores, and read the Terms of Service fine print so you don't have to. The table below is every host I hold a record for, on the plan I measured, with the plan named beside the figure.

Every Host Compared on One Screen
One row per review, on the plan that host was measured on. Every figure here is read from the same record the review page reads, so the table and the review cannot drift apart. Where a figure does not exist, the cell says so instead of borrowing one.
| Host | Plan measured | TTFB | Under full load ramp | Failed requests | Uptime | Intro → renewal |
|---|---|---|---|---|---|---|
| Kinsta | Single 20GB | 64ms origin | 44ms 0-250 ramp | 0 of 8,250 | 99.99% over 54 days | $29.17/mo → $29.17/mo +0%, billed for 12 months |
| WP Engine | Startup | 242ms origin | 231ms 0-250 ramp | 0 of 8,250 | 99.97% over 54 days | $25.00/mo → $25.00/mo +0%, billed for 12 months |
| Rocket.net | Starter | 32ms CDN edge | 66ms 0-250 ramp | 0 of 8,250 | 99.979% over 54 days | $25.00/mo → $25.00/mo +0%, billed for 12 months |
| WPX Hosting | Business | 32ms CDN edge | 162ms 0-250 ramp | 16 of 8,250 | 99.96% over 54 days | $29.99/mo → $29.99/mo +0%, month-to-month |
| Levamo | Starter | 127ms origin | 159ms 0-250 ramp | 8 of 8,250 | 99.97% over 54 days | $29.00/mo → $29.00/mo +0%, billed for 12 months |
| Namecheap EasyWP | Starter | 344ms origin | 1852ms 0-250 ramp | 211 of 8,250 | 99.92% over 54 days | $3.24/mo → $5.74/mo +77%, billed for 12 months |
| Liquid Web | VPS 4GB | 74ms origin | 91ms 0-250 ramp | 0 of 8,250 | 99.999% over 54 days | $8.50/mo → $17.00/mo +100%, month-to-month |
| ScalaHosting | Start | 23ms origin | 11ms 0-250 ramp | 0 of 8,250 | 99.997% over 54 days | $5.95/mo → $14.95/mo +151%, billed for 36 months |
| Cloudways | Vultr HF | 48ms origin | 32ms 0-250 ramp | 0 of 8,250 | 99.99% over 54 days | No canon join |
| SiteGround Cloud | Startup | 312ms origin | 319ms 0-100 ramp | 165 of 3,300 | 99.97% over 54 days | $3.99/mo → $17.99/mo +351%, billed for 12 months |
| Contabo | Cloud VPS S | 224ms origin | 190ms 0-250 ramp | 50 of 8,250 | 99.91% over 54 days | €5.50/mo → €5.50/mo +0%, month-to-month |
| Kamatera | Cloud Server 4GB | 52ms origin | 89ms 0-250 ramp | 0 of 8,250 | 99.94% over 54 days | No canon join |
| Hetzner | CPX11 | 118ms origin | 114ms 0-250 ramp | 0 of 8,250 | 99.95% over 54 days | No canon join |
| Vultr | HF 1GB | 53ms origin | 59ms 0-250 ramp | 0 of 8,250 | 99.97% over 54 days | No canon join |
| OVHcloud | Value | 186ms origin | 126ms 0-250 ramp | 0 of 8,250 | 99.95% over 54 days | No canon join |
| ChemiCloud | Starter | 84ms origin | 55ms 0-250 ramp | 0 of 8,250 | 99.97% over 54 days | $3.49/mo → $14.95/mo +328%, billed for 12 months |
| Hostinger | Premium | 276ms origin | 145ms 0-250 ramp | 66 of 8,250 | 99.95% over 54 days | $3.99/mo → $10.99/mo +175%, billed for 12 months |
| Hostinger India | Not in the benchmark canon | No canon join | ||||
| FastComet | Plus | 172ms origin | 277ms 0-250 ramp | 16 of 8,250 | 99.96% over 54 days | $3.99/mo → $17.95/mo +350%, billed for 12 months |
| Verpex | Bronze | 233ms origin | 351ms 0-250 ramp | 31 of 8,250 | 99.92% over 54 days | $3.00/mo → $6.00/mo +100%, billed for 12 months |
| Hosting.com | Startup | 172ms origin | 109ms 0-250 ramp | 31 of 8,250 | 99.91% over 54 days | No canon join |
| InMotion Hosting | Launch | 210ms origin | 351ms 0-250 ramp | 31 of 8,250 | 99.931% over 54 days | $4.79/mo → $14.99/mo +213%, billed for 12 months |
| DreamHost | Starter | 230ms origin | 404ms 0-250 ramp | 41 of 8,250 | 99.94% over 54 days | No canon join |
| Bluehost | Basic | 287ms origin | 3125ms 0-250 ramp | 3,534 of 8,250 | 99.9% over 54 days | $3.99/mo → $9.99/mo +150%, billed for 36 months |
| HostGator | Hatchling | 332ms origin | 2778ms 0-250 ramp | 2,952 of 8,250 | 99.87% over 54 days | $3.75/mo → $10.99/mo +193%, billed for 36 months |
| GoDaddy | Economy | 369ms origin | 2941ms 0-250 ramp | 3,252 of 8,250 | 99.83% over 54 days | $5.99/mo → $11.99/mo +100%, billed for 36 months |
| iPage no longer sold | Go Plan | 312ms origin | 885ms 0-100 ramp | 99 of 3,300 | 99.709% over 54 days | No canon join |
| Elementor Cloud shut down | Cloud Website | 164ms origin | 177ms 0-250 ramp | 16 of 8,250 | 99.95% over 54 days | No canon join |
How to read this table. Each row reports the one plan of that host I hold a record for, named in the second column, so a figure is never borrowed from a sibling plan. TTFB is the United States measurement against a stock WordPress install, and the cell says whether it was taken at the origin server or at a CDN edge, because those are different measurements and a 32ms edge figure is not a 300ms origin one. Under full load ramp is the average across the whole ramp the host was tested on, not a reading at one concurrency, and the ramp is printed beside it: two hosts ran a shorter 0-100 ramp and are not directly comparable with the rest. Uptime is a measured window, and the window length is printed rather than rounded up to a year.
Why some cells are empty. A price appears only where the canon can join the measured plan to a verified price for the same plan. Where a host is measured on a plan whose price has not been captured under the same name, the cell reads No canon join instead of showing a neighbouring plan's price. That is the table refusing to guess, and it is deliberate.
Rocket.net: Rocket.net serves every request from Cloudflare Enterprise, so the only figure on file is an edge measurement. There is no origin test for this host.
WPX Hosting: Measured behind the WPX CDN. The canon holds no origin test for WPX.
Liquid Web: The review covers Liquid Web’s Nexcess managed WordPress line. The plan on file is the Managed VPS 4GB, so that is what this row reports.
SiteGround Cloud: The review covers SiteGround Cloud. The canon holds SiteGround’s shared plans only, so this row reports StartUp shared rather than the Cloud plan the review is about.
Contabo: Contabo bills in euro, and the figure is what Contabo charges rather than a conversion. It has since retired the S/M/L names: the plan measured as Cloud VPS S is sold today as Cloud VPS 4, and the number is the vCPU count.
Hostinger India: Hostinger India is priced in rupees and tested from Mumbai. It has no record in the benchmark canon, which measures from the United States and Europe.
Hosting.com: Hosting.com is the brand A2 Hosting became.
Bluehost: Bluehost renamed this tier Starter. It is the plan the canon prices.
GoDaddy: GoDaddy sells this tier as Economy. The pricing canon files it under Basic, which is the same plan.
iPage: iPage no longer sells hosting. The measurement stands; the price does not, and the canon refuses it.
Elementor Cloud: Elementor Cloud has been shut down. The review is kept because the migration question outlives the product.
What 28 Reviews Have in Common
Read one review and you get one host. Read the table above as a set and two patterns show up that no single review makes obvious.
The gap between the fastest and the slowest is larger than the gap between the cheapest and the most expensive
On an identical WordPress install with no CDN in front of it, the fastest of the 27 measured plans answers in 38ms and the slowest answers in 369ms. That is the same page, the same test, the same week. Under a full load ramp the spread widens rather than closes: 25ms against 3125ms. Hardware and how many sites are queued behind you for it explain almost all of that, and no caching plugin closes a gap that size.
The failure counts matter more than the averages. 11 of the 27 measured plans finished their ramp with zero failed requests. Three did not come close: Bluehost Basic dropped 3,534 of 8,250 requests, GoDaddy Economy 3,252, and HostGator Hatchling 2,952. A slow response is an inconvenience. A dropped request is a visitor who saw an error page.
The renewal trap is a billing model, not a price tier
It is tempting to read the renewal column as cheap hosts being greedy and premium hosts being honest. That is not what the data says. What separates them is whether the host runs an introductory rate at all. 6 of the 18 plans the canon can price never raise their rate, because they never discounted it: Kinsta, WP Engine, Rocket.net, WPX Hosting, Levamo and Contabo all charge on renewal exactly what they charge on day one, and not one of them is a shared plan.
All 8 shared plans the canon can price raise their rate, and the range is wide. The gentlest is GoDaddy Economy at +100% ($5.99/mo to $11.99/mo). The steepest is FastComet at +350% ($3.99/mo to $17.95/mo). ChemiCloud Starter, the plan most often recommended as the budget pick, goes $3.49/mo to $14.95/mo, a +328% rise. None of that is hidden. All of it is on the vendor's own pricing page, in the row underneath the one the advertising quotes.
Which is the honest way to frame the choice: not fast versus cheap, but whether you would rather pay one rate forever or a low rate now and a high one from the second term onward. Both are defensible. Only one of them is what the advertised number describes.
All 28 Reviews
Grouped by what the host actually sells, because a managed WordPress plan and a shared plan are not competing for the same buyer. Each review includes the speed benchmarks, the uptime record, support response tests, and the fine print you won't find on the provider's website.
Managed WordPress 7
Hosts that run WordPress and nothing else, and manage the stack for you. Two of them are measured at the CDN edge rather than at the origin, and the table says which.

Kinsta Review 2026: 64ms on AMD EPYC 7502 vs the Real Cost Per Visit
Kinsta retired the plans this review was written against. Single 20GB is $29.17/mo flat, answered in 64ms at the origin with zero failed requests, and runs an AMD EPYC 7502, PassMark #248 of 5,999.

WP Engine Review 2026: 242ms on Startup, 79 Blocked Plugins, and Who Should Pay This
WP Engine Startup answered in 242ms at the origin, slower than hosts a fraction of the price, and holds $25/mo flat. You pay for Genesis and Smart Plugin Manager on a 25,000-visit cap.

Rocket.net Review 2026: 32ms at the Cloudflare Enterprise Edge, and No Origin Test
Rocket.net serves every request from Cloudflare Enterprise, so 32ms is an edge measurement and there is no origin figure to publish. It held 66ms across a full load ramp with zero failures.

WPX Hosting Review 2026: 32ms at the CDN Edge, and No Origin Test on File
WPX is measured behind its own CDN at 32ms, so there is no origin figure to publish. It held 162ms across a full load ramp, dropping 16 of 8,250 requests, at $29.99/mo flat.

Levamo Review 2026: 127ms on Starter, $29/mo Yearly, Full Benchmark Data
Levamo Starter answered in 127ms at the origin and held 159ms across a full load ramp, dropping 8 of 8,250 requests, at 99.97% uptime. It charges $29/mo billed yearly or $35 month to month, and renews...

Namecheap EasyWP Review 2026: 344ms on Starter, and the Limits Nobody Lists
EasyWP Starter answered in 344ms at the origin and slowed to 1,852ms across a full load ramp, dropping 211 of 8,250 requests. $2.49/mo renews at $5.49, with no email hosting and no cPanel.

Liquid Web Review 2026: 74ms on VPS 4GB and 99.999% Uptime Measured
Liquid Web VPS 4GB answered in 74ms at the origin, held 91ms across a full load ramp with zero failures, and logged 99.999% uptime, the highest in my set. It renews at double the intro.
Cloud and VPS 8
A server slice of your own. Prices in this group are mostly flat, because there is usually no introductory rate to expire.

ScalaHosting Review 2026: AMD EPYC 9474F, 28ms Origin TTFB on Start
ScalaHosting publishes its exact CPU and I verified it with lscpu: AMD EPYC 9474F, PassMark #42 of 5,999. The Start managed VPS answered in 23ms and held 11ms across a full load ramp.

Cloudways Review 2026: Four Servers on Three Clouds, Benchmarked and Tested Hands-On
Cloudways runs on DigitalOcean, Linode, Vultr, AWS or GCP. The Vultr High Frequency build answered in 48ms at the origin and held 32ms across a full load ramp with zero failed requests.

SiteGround Cloud Hosting Review 2026: Plans, Price and What We Tested
SiteGround Cloud is the product this review covers. My benchmark set holds SiteGround's shared plans, where StartUp answered in 312ms at the origin and renews from $3.99 to $17.99, a +351% rise.

Contabo Review 2026: EUR 5.50 for 4 vCPU, and Where the Shared I/O Shows Up
Contabo Cloud VPS 4 gives 4 vCPU and 8GB for EUR 5.50/mo, billed in euro and flat on renewal. I measured 224ms at the origin and 190ms across a full load ramp, with 50 of 8,250 requests failing.

Kamatera Review 2026: What a Real Production Server Costs
Kamatera advertises $4/mo, but the configuration I actually needed cost $71/mo. The 4GB cloud server answered in 52ms at the origin and held 89ms across a full load ramp with zero failures.

Hetzner Review 2026: 118ms on CPX11, and Pricing That Undercuts Every Managed Host
Hetzner CPX11 answered in 118ms at the origin from Europe and held 114ms across a full load ramp with zero failed requests. Unmanaged, so setup, security and backups are your job.

Vultr Review 2026: High Frequency vs Regular Compute
Vultr High Frequency 1GB answered in 53ms at the origin and held 59ms across a full load ramp with zero failed requests, at 99.97% uptime. Regular Cloud Compute is the cheaper, slower line.

OVHcloud Review 2026: Strong Hardware, Dated Experience, Full Benchmark Data
OVHcloud VPS Value answered in 186ms at the origin from Europe and held 126ms across a full load ramp with zero failed requests. The control panel is dated and management is a paid add-on.
Shared hosting 11
The cheapest way in, and the tier where the renewal multiple does the real damage. Every one of these that the canon can price charges more at renewal than on the first term.

ChemiCloud Review 2026: 84ms on Starter, and What the Renewal Actually Costs
ChemiCloud Starter answered in 84ms at the origin on LiteSpeed with zero failed requests across a full load ramp, at 99.97% uptime. The $3.49/mo intro renews at $11.95.

Hostinger Review 2026: 276ms on Premium and a +268% Renewal
Hostinger Premium answered in 276ms at the origin and dropped 66 of 8,250 requests across a full load ramp. The $2.99/mo intro renews at $10.99, a +268% rise.

Hostinger India Review 2026: Mumbai TTFB, INR Pricing & Support
Hostinger India advertises ₹69/mo but renews at ₹293/mo once 18% GST lands, a 325% real increase. I measured TTFB from Mumbai across the shared plans.

FastComet Review 2026: 172ms on Plus and a +350% Renewal
FastComet Plus answered in 172ms at the origin with no CDN, at 99.96% uptime, but the $3.99/mo intro renews at $17.95, a +350% rise. 16 of 8,250 requests failed under a full load ramp.

Verpex Hosting Review 2026: 233ms on Bronze and 99.92% Uptime Measured
Verpex Bronze answered in 233ms at the origin with no CDN and slowed to 351ms across a full load ramp, dropping 31 of 8,250 requests. The $1.80/mo intro renews at $6.00, a +233% rise.

Hosting.com Review 2026: 172ms on StartUp, and the A2 Hosting Brand It Replaced
Hosting.com is the brand A2 Hosting became. StartUp answered in 172ms at the origin and held 109ms across a full load ramp, dropping 31 of 8,250 requests, at 99.91% uptime.

InMotion Hosting Review 2026: 210ms on Launch and 351ms Under a Full Load Ramp
InMotion Launch answered in 210ms at the origin and slowed to 351ms across a full load ramp, dropping 31 of 8,250 requests. The $4.79/mo intro renews at $14.99, a +213% rise.
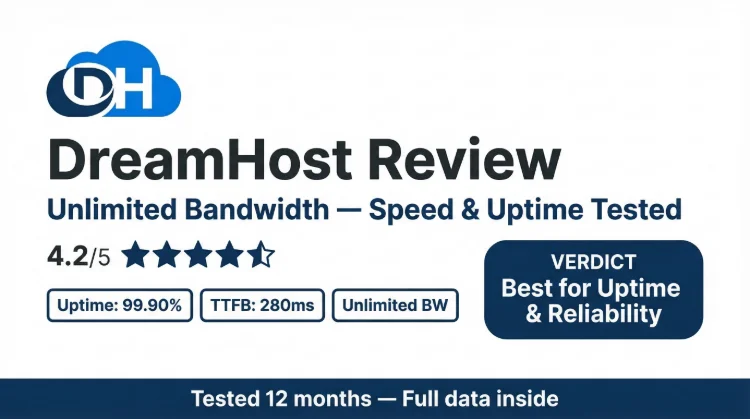
DreamHost Review 2026: The 97-Day Refund Is Real, the 230ms Is the Catch
DreamHost has the longest money-back guarantee I have found at 97 days, but Starter answered in 230ms at the origin on an Apache stack with no LiteSpeed, and slowed to 404ms under load.

Bluehost Review 2026: 287ms, Newfold Ownership, and 43% of Requests Dropped
Bluehost Starter answered in 287ms at the origin and dropped 3,534 of 8,250 requests across a full load ramp, the worst in my set. I also map the Newfold ownership chain and the checkout costs.

HostGator Review 2026: 332ms, a 2016 Xeon, and 36% of Requests Dropped
HostGator Hatchling answered in 332ms at the origin and dropped 2,952 of 8,250 requests under load. Its Intel Xeon E5-2690 v4 ranks #1,069 of 5,999 on PassMark. $3.75/mo renews at $10.99.

GoDaddy Hosting Review 2026: 369ms, a 2017 Xeon, and 39% of Requests Dropped
GoDaddy Economy answered in 369ms at the origin, the slowest in my set, and dropped 3,252 of 8,250 requests under a full load ramp. It runs an Intel Xeon Silver 4114, PassMark #1,468 of 5,999.
No longer sold 2
Two products that cannot be bought today. The reviews stay up because the question they answer is now a migration question.

iPage Review 2026: The Brand Is Gone, and the Benchmark Data Explains Why no longer sold
iPage no longer sells hosting. While it did, the Go plan answered in 312ms at the origin and logged 99.709% uptime, the lowest I measured. Kept as a record of where that tier ended.

Elementor Cloud Is Shut Down: Where to Move, and What I Measured shut down
Elementor Cloud has been discontinued. Before it closed it answered in 164ms at the origin and held 177ms across a full load ramp. Here are the hosts I tested as replacements, with the data.
How these numbers were produced
Every plan in the table was bought at retail with my own money, on the term the vendor sells it on, with no vendor-supplied account and no press access. Each one runs the same install: WordPress with the default theme, no caching plugin, and any CDN switched off, so what the origin column reports is server speed and nothing else. Where a host cannot be tested that way, because it serves everything from a CDN edge, the row says CDN edge rather than pretending an origin figure exists.
Response times are a ten-location measurement and the table prints the United States figure. Load is a single ramp per plan, and the table reports the average across the whole ramp plus the number of requests that failed during it. It does not report a reading at one concurrency, because a per-concurrency export does not exist for these plans, and inventing one to fill the column is the thing this site is built not to do. Uptime is computed from real incident minutes over a measured window of 54 days, and that window length is printed in every cell rather than rounded up to a year.
Prices are read from each vendor's own pricing page and dated. They are never converted between currencies: Contabo bills in euro and the table says so. The full method is here, and every figure on this page can be traced to the record it came from.