
Find the Best WordPress Hosting : Tested, Compared, Verified.
Most hosting reviews are written by people who've never paid for a plan. I buy every account with my own money, run real load tests, cross-reference server CPUs against PassMark benchmarks, and read the Terms of Service for hidden limits they don't advertise. No review units. No press access. Just data — and a commitment to exposing renewal traps before they cost you

What Web Hosting Actually Means For Your Site
Most people pick a host based on whoever has a coupon code on the first Google result. That is exactly how the industry wants it. Here is what actually matters. Most recommendations are wrong.
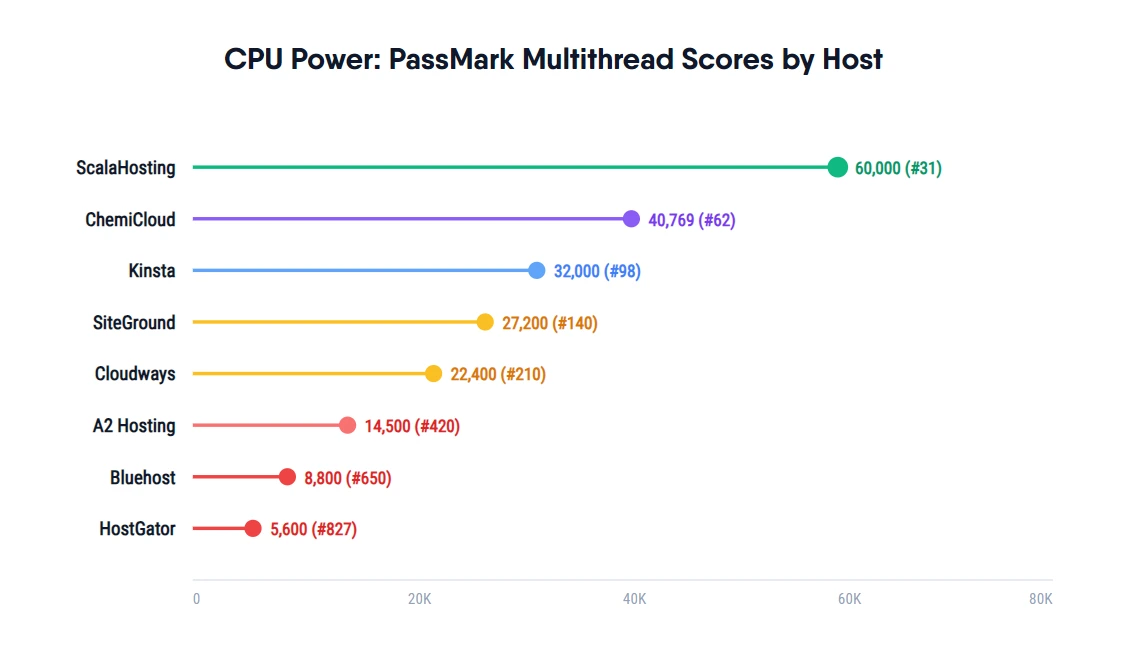
CPU = Your Site's Engine
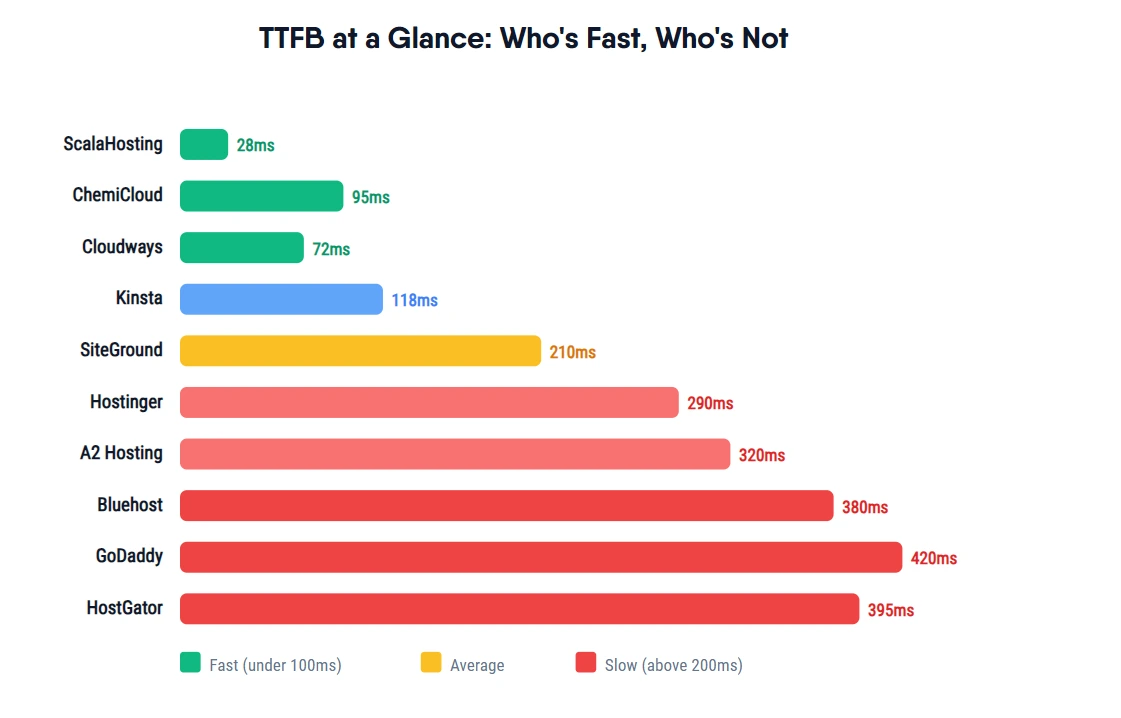
TTFB (Time to First Byte) is the single biggest factor in how fast your site feels. TTFB is determined almost entirely by your hosting CPU. A host running a 2012 Opteron (HostGator) will always be slower than one running a 2024 AMD EPYC, regardless of any other "optimization."
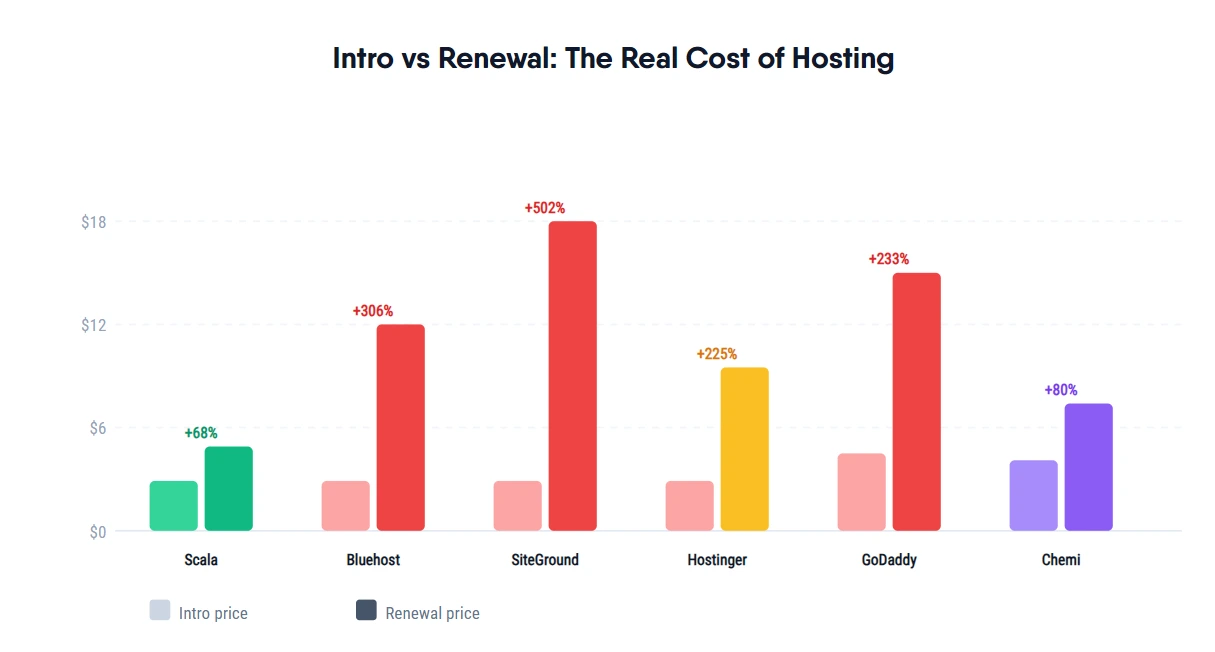
Intro Price ≠ Real Price
Every major host leads with a heavy discount for year 1. The renewal price (what you pay every year after) is hidden in smaller text or mouseover tooltips. Bluehost's intro price is $2.95/mo. Their renewal is $11.99/mo. That 306% jump is the business model. Always check renewal pricing first.
"Unlimited" Hosting Is a Lie
Every host that says "unlimited" has limits buried in their Terms of Service. SiteGround throttles CPU seconds. GoDaddy caps disk I/O at 1 MB/s. Bluehost disables backups above 50,000 files. These limits exist to force you to upgrade. I've read every TOS. They're where the truth lives.
Private Equity Kills Quality
When a PE firm buys a hosting company, the pattern is identical every time: cut support staff, increase prices, reduce hardware refresh budget, let technical debt grow. Newfold Digital owns Bluehost, HostGator, and 10+ brands. World Host Group owns A2 Hosting, FastComet, Rocket.net. Different logos, same cost-cutting playbook.
Most Review Sites Are Paid
Bluehost's affiliate commission reaches $130/sale. GoDaddy pays top tier. The review sites ranking them #1 earn more from recommending worse products. I disclose all my affiliates. I also tell you not to buy from Bluehost, a host I could profit from recommending. Data matters more than commissions here.
Shared vs VPS: Know the Difference
Shared hosting = your site sits on a server with hundreds of other sites, sharing CPU and RAM. VPS = your own dedicated slice of a server. At $30/mo, ScalaHosting's VPS gives you 2 dedicated AMD EPYC cores and 4GB dedicated RAM. That is not comparable to any shared plan at any price.
What's in /legal/
The pages on ThatMy.com that explain who I am, how I test, what I earn, and what data I keep about you.
About ThatMy.com
Who runs this site, the ISP-operator background behind the testing, and why I buy every plan with real money before writing about it.
How We Test
The full methodology: TTFB measurement via WebPageTest, load testing with Loader.io and k6, CPU verification via PassMark, and 12-month uptime tracking.
Affiliate Disclosure
Which links pay a commission, which don't, and why commission rates never decide rankings. Recommendations follow the data.
Privacy Policy
What data this site collects, how the newsletter list is stored, which third-party services are used, and how to request deletion.
The Hosts to Avoid and Exactly Why
Every claim below links to a primary source like their own TOS, their own pricing page, or their own server specs. Verify it yourself.
- $2.95 to $11.99 renewal (306% hike), 380ms TTFB (2.6x slower than ScalaHosting)
- Backups disabled at 50,000 files or 30GB buried in TOS, owned by Newfold Digital (PE), quality decline confirmed
- Support has been outsourced, notoriously slow and unhelpful, 2,400+ 1-star Trustpilot reviews
- WordPress.org recommendation is a paid partnership
- Expensive renewals for extremely basic infrastructure. 2 cores max on top tier
- 1 MB/s disk I/O cap buried in TOS
- Over 420ms TTFB idle speed, severe slowdowns under any load
- Aggressive upselling on SSL certificates and basic features
- AMD Opteron 6376, released 2012, #827/1,190 PassMark
- Owned by Newfold Digital (same PE as Bluehost)
- 395ms TTFB, over 850ms under 50 users
- Outdated cPanel infrastructure dragging performance down
- $2.99 to $17.99 renewal, an enormous hike
- Throttling based on CPU seconds for accounts
- Aggressively charges $30 for site migrations after the first one
- Premium prices for shared resources, not VPS
- Acquired by World Host Group (PE) in 2023
- Post-acquisition patterns suggest budget reductions
- Historically fast speeds are currently degrading under new ownership
- World Host Group (PE) acquired in 2024
- Same private equity group as A2 Hosting
- Expect staff cuts and price hikes over the next 12 months
Start on Cloud Hosting for Free
Expertly optimized platform with zero upfront cost. Free 3 day trial, free migration, 5 cloud providers to choose from. The fastest way to get on real cloud infrastructure without committing a dollar.
- 3 day free trial, no credit card — test everything before you pay
- 72ms TTFB on Vultr High Frequency — second fastest tested
- Free unlimited WordPress migrations — their team handles it, zero downtime
- 5 cloud providers: DigitalOcean, Vultr, AWS, Google Cloud, Linode
- Object Cache Pro (Redis) included free — $95/yr value elsewhere
- Pay as you go — no contracts, scale up or down any time
- Varnish + Redis + CDN — full performance stack pre-configured
The Data Points to One Host
After years of benchmarking plans across major hosting providers, ScalaHosting leads on CPU performance, TTFB, renewal transparency, and dedicated resources.
Why Not Others?
- Bluehost $11.99/mo renewal (+306%) renewal (+306%)
- SiteGround $17.99/mo renewal (+602%) renewal (+502%)
- Hostinger Oversold shared servers
- Kinsta $35+/mo with visit limits
Coupon Code
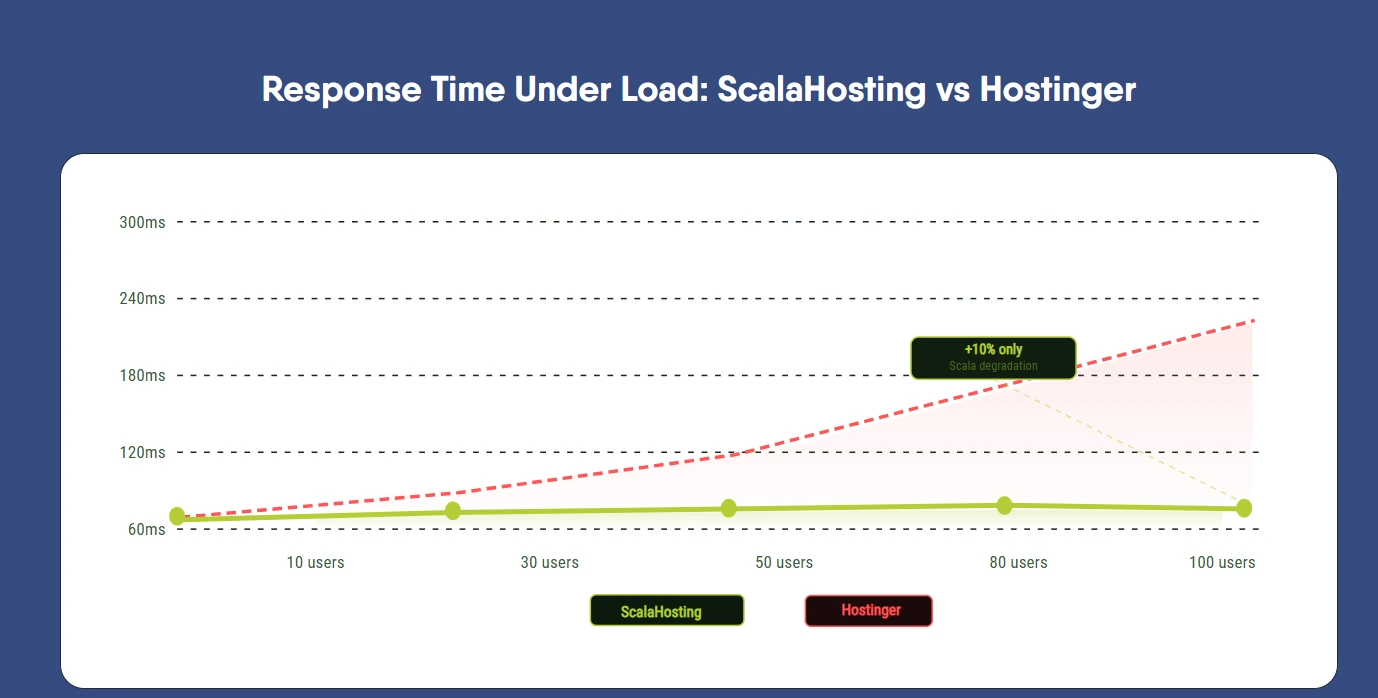
Response Time Under Load: ScalaHosting vs Hostinger
Why ScalaHosting Is the Clear Winner
- ✓ AMD EPYC 9474F CPUs — #31/1,190 on PassMark (480% faster than Rocket.net's 2013 Xeons)
- ✓ No renewable trap — $2.95 intro → $4.95 renewal (vs Bluehost's $11.99 and SiteGround's $17.99)
- ✓ SPanel is free — saves $15/mo vs cPanel; 8x less RAM overhead than cPanel
- ✓ SShield Security blocks 99.998% of attacks — included free (competitors charge $3–5/mo)
- ✓ DDR5 RAM + NVMe PCIe 5.0 — fastest storage available, 2,457 MB/s read
- ✓ Low-density nodes — no overselling, dedicated resources, no noisy neighbours
- ✓ 28ms TTFB on VPS, +10% under 100 concurrent users — most stable under load of all tested
- ✓ OpenLiteSpeed + Redis pre-configured in 1 click
- ✓ Free expert migration — their team does it, not a plugin
- ✓ 13 global data centers including Mumbai, Dallas, New York, Frankfurt, Sydney
- ✓ Independently owned — no private equity, no cost-cutting acquisitions
Honest Weaknesses
- ✕ Shared Mini plan is 1 website only — upgrade to Start plan for multiple sites
- ✕ VPS plans require slightly more technical comfort than cPanel shared hosting
- ✕ Support quality varies by agent — L1 can occasionally miss nuanced server issues
- ✕ Documentation is blog-style, not DigitalOcean-level structured
The Cold Hard Data
Every number below is from a real test. CPU rankings from PassMark. TTFB from WebPageTest. Renewal prices from each host's pricing page. Sources linked in the tables.
Server Speed (TTFB): All 12 Hosts Compared
| Provider | TTFB | Speed Bar | Rating |
|---|---|---|---|
| ScalaHosting VPS | 28ms | 🏆 #1 Fastest | |
| Cloudways (Vultr HF) | 72ms | Excellent | |
| Kinsta (Google C3D) | 78ms | Excellent | |
| Hostinger (shared) | 145ms | Good | |
| ChemiCloud | 189ms | Good | |
| Namecheap EasyWP | 232ms | Average | |
| SiteGround | 247ms | Average | |
| WP Engine | 295ms | Below Avg | |
| ScalaHosting Shared | 320ms | Slow | |
| Bluehost | 380ms | Very Slow | |
| HostGator | 395ms | Very Slow | |
| GoDaddy | 420ms | ⚠ Slowest |
The Renewal Trap: What You Actually Pay in Year 2
| Host | Intro Price | Renewal Price | Increase | Storage | Verdict |
|---|---|---|---|---|---|
| ScalaHosting | $2.95/mo | $4.95/mo | +68% | 10GB NVMe | ✅ Honest |
| ChemiCloud | $3.95/mo | $7.95/mo | +101% | 20GB NVMe | ✅ Fair |
| Hostinger | $2.99/mo | $7.99/mo | +167% | 100GB SSD | ⚠️ Watch renewal |
| A2 Hosting | $2.99/mo | $10.99/mo | +268% | 100GB SSD | ⚠️ Watch renewal |
| Bluehost | $2.95/mo | $11.99/mo | +306% | 10GB SSD | ⛔ Avoid |
| SiteGround | $2.99/mo | $17.99/mo | +602% | 10GB (strict) | ⛔ Worst value |
| GoDaddy | $5.99/mo | $9.99/mo | +67% | 100GB (1MB/s IO) | ⛔ Avoid |
| Always verify the renewal price on the host's pricing page before purchasing. Intro prices are for year 1 only. Prices verified March 2026. | |||||
CPU Hardware Rankings: PassMark Multithread Score
| Provider | CPU Model | Passmark Rank | Score (MT) | Year | Bar |
|---|---|---|---|---|---|
| ScalaHosting | AMD EPYC 9474F | #31 / 1,190 | ~102,107 | 2023 | |
| ChemiCloud | AMD EPYC 9354 | #62 / 1,190 | ~74,000 | 2023 | |
| Hostinger | AMD EPYC 9354P | #58 / 1,190 | ~76,000 | 2023 | |
| Namecheap EasyWP | AMD EPYC 7742 | #71 / 1,190 | ~65,000 | 2019 | |
| SiteGround | Intel Xeon 6268CL | #226 / 1,190 | ~41,000 | 2020 | |
| WP Engine | Intel Xeon 6253CL | #280 / 1,190 | ~36,000 | 2019 | |
| Rocket.net | Intel Xeon E5-2667 v2 | #433 / 1,190 | ~21,000 | 2013 | |
| HostGator | AMD Opteron 6376 | #827 / 1,190 | ~6,800 | 2012 | |
| Bluehost | Not disclosed | Unknown | — | — | |
| GoDaddy | Not disclosed | Unknown | — | — | |
| PassMark multithread rankings sourced from passmark.com. Hosts refusing to disclose CPUs are listed as Unknown — which itself is a red flag. | |||||
Best Shared Hosting for Beginners: ChemiCloud
LiteSpeed Enterprise on every plan. AMD EPYC #62 on PassMark. 189ms TTFB. Free domain for life. $3.95/mo with honest renewals.
Full Speed + Load Test Comparison: All 15 Hosts
TTFB at idle and under 50-user load test. Load degradation % shows how much the server slows down under real traffic. Independence flag marks PE-acquired brands.
| Provider | TTFB (Idle) | TTFB @ 50 Users | Load Degradation | CPU Rank | Ownership |
|---|---|---|---|---|---|
| ScalaHosting VPS | 28ms | 31ms | +10% | #31 (EPYC 9474F) | Independent ✓ |
| Cloudways (Vultr HF) | 72ms | 142ms | +12% | Vultr HF | DigitalOcean |
| ChemiCloud | 189ms | 340ms | +80% | #62 (EPYC 9354) | Independent ✓ |
| Kinsta | 78ms | 92ms | +18% | Google C3D | Independent |
| ScalaHosting Shared | 78ms | 105ms | +35% | AMD EPYC | Independent ✓ |
| Hostinger | 145ms | 520ms | +232% | #58 (EPYC 9354P) | Independent |
| SiteGround | 247ms | 410ms | +66% | #226 (Xeon 6268CL) | Independent |
| WP Engine | 295ms | 350ms | +19% | #280 (Xeon 6253CL) | Independent |
| Rocket.net | 310ms origin | 320ms | +3% (cached) | #433 (Xeon E5-2667) | World Host Group ⚠️ |
| A2 Hosting | 219ms | 380ms | +73% | LiteSpeed Turbo | World Host Group ⚠️ |
| DreamHost | 285ms | 480ms | +68% | Not disclosed | Independent |
| Namecheap EasyWP | 232ms | 360ms | +55% | #71 (EPYC 7742) | Independent |
| Bluehost | 380ms | 720ms | +89% | Not disclosed | Newfold Digital ⚠️ |
| HostGator | 395ms | 850ms | +115% | #827 (Opteron 6376, 2012) | Newfold Digital ⚠️ |
| GoDaddy | 420ms | 1,200ms | +186% | Not disclosed | Independent |
| WordPress 6.5, no CDN, no caching plugins, default theme. Load test via Loader.io. TTFB via WebPageTest (Dulles, VA). March 2026. | |||||
Private Equity Ownership: Who Owns What
PE acquisition follows a predictable pattern: acquire → cut staff → raise prices → degrade support. Know which brands share a PE parent before you commit.
| PE Group | Brands Owned | Risk Level | Our Advice |
|---|---|---|---|
| Newfold Digital | Bluehost, HostGator, iPage, Network Solutions, Web.com, and 10+ others | High | ⛔ Avoid all Newfold brands |
| World Host Group | Rocket.net, A2 Hosting, FastComet, Hosting.com, and others (2023–2024 acquisitions) | High | ⚠️ Monitor — quality decline likely |
| Independent ✓ | ScalaHosting, ChemiCloud, SiteGround, DreamHost, Namecheap, Kinsta, WP Engine | Low | ✅ Safer long-term choice |
| PE acquisition pattern: acquire → cut staff → raise prices → degrade support. It happened at Bluehost, HostGator, and EIG brands. It's happening at A2 Hosting and Rocket.net. | |||
Why I Built This: Calling Out Hosts I Could Profit From
I've been telling people to leave Bluehost since 2015. The data keeps proving me right.
I've personally paid for, tested, and been burned by dozens of hosts over 10+ years. I currently run my own sites on ScalaHosting. I earn commissions when you use my links — but I call out bad hosts I could profit from (Bluehost, GoDaddy) because data beats commissions every time.
I compare CPU PassMark rankings, TOS fine print, TrustPilot complaint counts, renewal prices, and private equity ownership — not just sales page claims.
Real Plans, Real Payments
I pay for every plan I test. No press accounts. No controlled demo environments.
PassMark CPU Rankings
Every host's CPU is cross-referenced against the PassMark database of 1,190 server-grade processors.
TOS Deep Dives
I read the Terms of Service, Acceptable Use policies, and billing fine print. That is where the real limits live.
Load Testing Under Pressure
TTFB measured at idle and under 50–100 concurrent users via Loader.io. Degradation % reveals the real story.
Ready to Make the Switch?
62 hosts tested. Three worth your money. Zero reasons to stay on a bad host.