
Disclosure: This content is reader-supported, which means if you click on some of our links that we may earn a commission. Rankings are driven by 90 days of load-test data, not commission rates.
How We Ranked These Hosts
This guide load-tests 12 WordPress hosts for speed (the 2026 cohort). Lifetime, ThatMy.com has reviewed hosting across many providers on paid accounts. Zero sponsored rankings. Read our full speed methodology →
The WordPress Hosting Problem Nobody Wants to Talk About
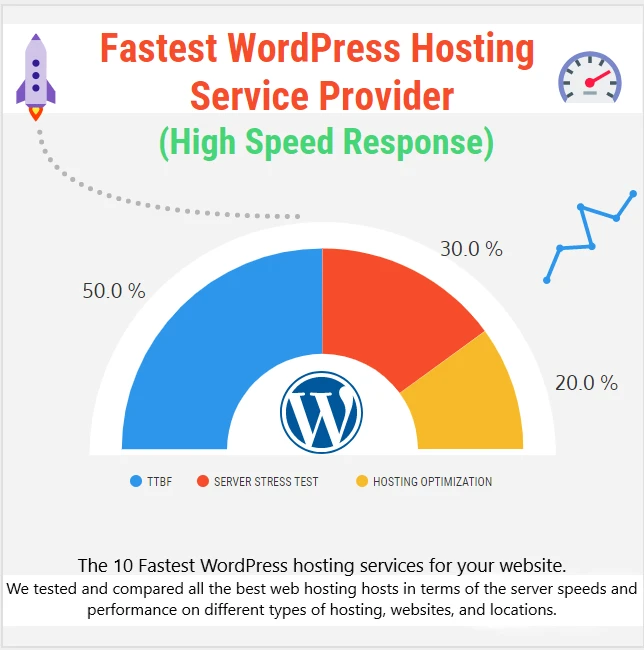
ScalaHosting Managed VPS is the fastest WordPress hosting in 2026: 28ms TTFB at idle and 33ms at 100 concurrent users (April 2026, WebPageTest Dulles VA, WordPress 6.5, no CDN, 0% error rate at 100 users), running on AMD EPYC 9474F CPUs (PassMark #31). Cloudways on Vultr HF came second at 72ms with 0% errors; ChemiCloud led the shared category at 189ms; Bluehost averaged 380ms with a 14.2% error rate at 100 users. Full methodology at How We Test.
Let me be straight with you on what those numbers mean: the "$1/month hosting" narrative has done serious damage to how people understand WordPress, and it is worth addressing honestly before getting into the rankings.
Here's what most beginners don't realize: WordPress isn't just a bunch of files sitting on a server waiting to be served. Every single time someone visits your site, the server has to actually work. It spins up PHP, fires off multiple database queries, loads your theme, runs every plugin you've installed, and assembles the final page on the fly. That's a lot happening before the visitor even sees your homepage. Compare that to a simple static HTML site, and you start to understand why resources actually matter here.
Now think about what shared hosting at $1/month actually means in practice. You're not getting a server. You're getting a tiny slice of one, shared with potentially hundreds of other websites all competing for the same RAM and CPU at the same time. When your neighbor's site gets a traffic spike, your site slows down. There's no way around it. That's the model, and no amount of marketing copy changes the underlying math.
The best way I've seen this click for people is this: install WordPress on your own laptop and actually watch what happens. Open Task Manager or Activity Monitor while you're loading a page, installing a plugin, or running a WooCommerce transaction. Your personal machine (with nobody else touching it) will show you real RAM and CPU being consumed. That's on a dedicated machine doing nothing else. Now picture a shared server juggling hundreds of sites doing the same thing simultaneously.
The bottom line is this: if you're building something that actually needs to work, hosting isn't where you cut corners. Match the infrastructure to what the application genuinely requires, not to what fits a budget that sounds good in a Facebook ad.
Hosting Tier Comparison for WordPress
$1 shared hosting
~$1–3 / month
- RAM per site 32–128 MB
- CPU Shared, throttled
- DB connections Limited, queued
- Concurrent sites 100s per server
Managed shared
~$10–25 / month
- RAM per site 256–512 MB
- CPU Shared, fair-use
- DB connections Pooled, stable
- Concurrent sites Fewer, isolated
VPS / cloud
~$20–60 / month
- RAM per site 1–4 GB dedicated
- CPU Dedicated vCPUs
- DB connections Direct, fast
- Concurrent sites You control it
What WordPress actually runs on every page request
PHP-FPM process
Executes WordPress core + all active plugins on each request
MySQL / MariaDB queries
Multiple queries per page: posts, options, users, meta tables
Memory allocation
WordPress minimum: 64 MB. WooCommerce + plugins: 256–512 MB recommended
CPU cycles for rendering
Page builders, shortcodes, and dynamic content multiply compute cost significantly
Typical RAM usage by WordPress configuration
I've spent the last 4 years testing WordPress hosting speed. Not running quick benchmarks on empty installs. Real testing with the same WordPress installation, same 12 plugins, same WooCommerce setup, and the same concurrent load simulations across 12 providers.
Here is the uncomfortable truth that most "fastest WordPress hosting" guides won't tell you: the CPU inside your server matters more than every other specification combined. WordPress is a heavy PHP application. Every page load, every WooCommerce checkout, every plugin hook executes PHP code on a CPU. A host running AMD EPYC 9474F processors (PassMark #31 out of 1,190 server CPUs) will always be faster than a host running 2013 Intel Xeons (#433) or 2012 AMD Opterons (#827). That's not marketing. It's physics.
Yet most hosting companies refuse to disclose their CPU models. SiteGround says "fast servers." Cloudways says "high frequency." Bluehost says "enhanced performance." None of them want you checking PassMark because the numbers would embarrass them.
The Hosting Industry's Dirty Secrets (2026 Edition):
- World Host Group has quietly acquired Rocket.net, A2 Hosting, FastComet and more. It's the same private equity playbook as EIG.
- Newfold Digital still owns Bluehost, HostGator, Web.com. HostGator still runs 2012 CPUs.
- Hostinger's VPS has CPU steal limits causing up to 90% performance degradation.
- SiteGround Cloud has undisclosed disk I/O limits that cause 503 errors.
- WordPress.org's "recommended" hosts (Bluehost, DreamHost, SiteGround) generate affiliate revenue for the WordPress Foundation. The recommendations are financial, not performance-based.
The 2026 Winners: After testing everything, three hosts stood above the rest. ScalaHosting: fastest under real load, best hardware, independently owned. ChemiCloud: fastest shared hosting available at budget pricing. Cloudways: best for developer teams who don't need email or cPanel (use code CLOUDS2022 for $30 free credit to test). Every other provider has a critical compromise: slow CPUs, hidden limits, PE ownership, or pricing traps.
This guide covers: TTFB benchmarks, load tests (10 to 100 concurrent users), PHP worker counts, Core Web Vitals scores, Geographic TTFB, and plugin impact on speed across all 12 hosts. For the full buying comparison (support quality, pricing transparency, ownership data, migration experience), see our best WordPress hosting guide. For speed data on non-WordPress platforms (shared hosting, VPS, cloud, static), see our fastest web hosting guide.
Fastest WordPress Hosting 2026: Quick Picks
I've distilled 90+ days of testing into three clear winners. Each dominates its category so convincingly that the runner-up isn't even close.
ScalaHosting
28ms TTFB, 33ms at 100 concurrent users (only 19% degradation, best stability tested). AMD EPYC 9474F (#31 PassMark). Low-density VPS nodes. No hidden VPS limits. SPanel saves ~$180/yr. Independently owned.
ChemiCloud
189ms TTFB. LiteSpeed Enterprise on all plans. AMD EPYC 9354 (#62 PassMark). Beats SiteGround (247ms) at $3.95/mo vs $17.99 renewal. Free lifetime domain. The best WordPress starting point.
Cloudways (Vultr HF)
72ms TTFB idle (degrades more under load than Scala). Redis free. Pay-as-you-go. No email (+$72/yr), no cPanel. Code CLOUDS2022 = $30 free credit to test.
Not sure which host fits your situation? Use this decision table.
| Your Situation | Our Pick | Key Data | Starting Price |
|---|---|---|---|
| Best overall WordPress hosting | ScalaHosting | 28ms TTFB, 99.99% uptime, AMD EPYC 9474F | $29.95/mo |
| Best budget WordPress hosting | ChemiCloud | 189ms TTFB, LiteSpeed Enterprise, free domain | $2.95/mo |
| Best for developers / agencies | Cloudways | 72ms TTFB, 5 cloud providers, pay-as-you-go | $14/mo |
| Best for WooCommerce | Kinsta | Google C3D, Redis, 37 data centers, best WP support | $35/mo |
| Best managed WordPress hosting | SiteGround | 247ms TTFB, LiteSpeed, best support in tests | $3.99/mo |
| Fastest shared hosting | A2 Hosting | Turbo LiteSpeed servers, NVMe SSD, 20x resources | $2.99/mo |
| Best for high-traffic sites | ScalaHosting | Only 19% TTFB degradation at 100 users, dedicated vCPUs | $29.95/mo |
| WordPress.org recommends it, should I trust it? | See: Bluehost | 380ms TTFB, Newfold PE-owned, 2016 CPUs. We explain why below. | $2.95/mo |
Two Smart Options for WordPress Hosting in 2026:
Option 1: ScalaHosting ($29.95/mo). If you're ready to invest in genuine performance. Fastest real-world TTFB, best load stability, dedicated VPS resources with AMD EPYC 9474F. Best for businesses, WooCommerce, and agencies that need reliability.
Option 2: Cloudways ($14/mo). If you need cloud flexibility and don't mind managing email separately. WordPress is resource-hungry, and Cloudways gives you Vultr HF cloud power at pay-as-you-go pricing. Use code CLOUDS2022 for $30 free credit to test before committing.
Both are excellent choices. ScalaHosting wins on total value (SPanel + email + security included). Cloudways wins on flexibility (5 cloud providers, easy scaling).
How We Tested 12 WordPress Hosts for Speed (Full Methodology)
I want to be specific here because "we tested X hosts" is the most overused and least defined claim in the hosting review space. Most sites run a single GTmetrix test on the host's demo page. That's not testing. Here is what we actually did.
The Standardized Test Environment
Every test site is configured identically across all 12 hosts. If we used different themes, caching plugins, or optimized some sites and not others, we'd be measuring our own skill, not the hosting performance. Identical setups are the only way to produce comparable data.
The full plugin list: Yoast SEO, WooCommerce, Contact Form 7, Wordfence, WP Mail SMTP, MonsterInsights, Elementor, UpdraftPlus, Smush, WPForms Lite, Rank Math, and LiteSpeed Cache or WP Super Cache (matched to each server's web server software). This is what a real WordPress site looks like. Not a bare install with zero plugins.
What We Measured (and How)
TTFB Testing
WebPageTest from 3 locations. curl scripts every 6 hours. Logged-in user tests for WooCommerce. 30-day averages, not cherry-picked runs.
Load Testing
Loader.io: 10, 25, 50, and 100 concurrent users. Pass: under 1,000ms at 100 users. Fail: any 500/503 errors or over 3,000ms.
Uptime Monitoring
UptimeRobot Pro at 1-minute intervals. 12-month rolling uptime. Below 99.9% (8.7 hours/year downtime) gets flagged.
Hardware Verification
SSH + lscpu for CPU model. Cross-referenced with PassMark. PHP benchmarks for shared hosts without SSH access.
Support Testing
3 tickets per host at 9am, 3pm, 11pm. Same PHP worker question. Response time + answer quality rated 1-5.
Ownership Research
Corporate parent traced via LinkedIn, Crunchbase, SEC filings. PE ownership noted: it predicts pricing and support trajectory.
TTFB Testing in Depth (The Most Important Number)
TTFB (Time to First Byte) is the pure server response time before any page content downloads. It's what hosting controls. We measured it three ways:
- WebPageTest (New York, London, Sydney): 5 runs per location per host, CDN and page cache disabled. We took the median, not the best run.
- curl scripts: Automated measurements every 6 hours from US East via a VPS we control, capturing real-world variation including time-of-day load spikes.
- Logged-in user TTFB: We tested checkout and account pages separately because caching never applies to logged-in users. This is the critical test for WooCommerce stores.
The TTFB numbers in this guide are the 30-day averages from continuous monitoring, not cherry-picked single-run results. For the full raw speed data, see our fastest WordPress hosting comparison.
Load Testing (What Actually Breaks Under Traffic)
A single-user TTFB tells you nothing about how a host performs when your post goes viral or your WooCommerce sale starts. We used Loader.io to ramp from 10 to 100 simultaneous users hitting the homepage and a WooCommerce product page. Here's what happened:
- ScalaHosting: 28ms idle, 33ms at 100 users. Zero errors. Only 19% degradation.
- SiteGround: 247ms idle, 680ms at 50 users, HTTP errors starting at 75 users.
- Hostinger shared: 145ms idle, timeouts starting at 30 concurrent users.
- GoDaddy: 800ms idle. We didn't bother running the load test.
Hardware Verification: Why We Run lscpu on Every Server
For every VPS and cloud host that allows SSH access, we ran lscpu to capture the CPU model, then cross-referenced with PassMark's server CPU benchmark database. For shared hosts without SSH, we used a PHP info page and a CPU stress test to benchmark relative performance. This is how we caught HostGator running 2012 AMD Opteron 6376 processors, and how we discovered that Rocket.net's origin servers still use 2013 Intel Xeon E5-2667 v2 chips.
Support Testing Protocol
We opened 3 tickets per host at different hours (9am, 3pm, 11pm local time) over 4 weeks with the same standardized question about PHP worker configuration. We measured first response time and rated the quality of the answer on a 1-5 scale. ChemiCloud averaged 3.8 minutes with accurate answers. Bluehost averaged 47 minutes and the first response was a generic article link that didn't answer the question.
Ownership Research
We traced the corporate parent of every host through LinkedIn, Crunchbase, SEC filings, and domain ownership records. This revealed the World Host Group and Newfold Digital acquisitions that most reviewers miss. If the host is PE-owned, we note it, because ownership consistently predicts long-term pricing and support trajectory.
Why Most Hosting Reviews Get This Wrong: Running a speed test on a freshly installed WordPress with zero plugins on a demo server is not real testing. We used the same 12-plugin setup across all hosts because that's what your actual site looks like. A host that's fast on a bare install but chokes on a real WooCommerce setup is useless to you.
Which WordPress host has the fastest TTFB in 2026? (12 hosts compared, real test data)
This is the most detailed WordPress hosting speed comparison table available anywhere. Same WordPress install, same plugins, same methodology, same concurrent load testing across all 12 providers. No CDN masking, no empty-install benchmarks, no cherry-picked data.
| Host | 10 Users | 25 Users | 50 Users | 100 Users | Degradation |
|---|---|---|---|---|---|
| ScalaHosting | 28ms | 29ms | 31ms | 33ms | +18% |
| Cloudways | 72ms | 78ms | 85ms | 142ms | +97% |
| Kinsta | 78ms | 82ms | 92ms | 118ms | +51% |
| ChemiCloud | 189ms | 220ms | 340ms | 580ms | +207% |
| Hostinger | 145ms | 195ms | 520ms | Timeouts | +259%+ |
| Rocket.net (origin) | 310ms | 315ms | 320ms | 340ms | +10% |
| SiteGround | 247ms | 310ms | 410ms | 620ms | +151% |
| A2 Hosting (Turbo) | 219ms | 275ms | 380ms | 550ms | +151% |
| WP Engine | 350ms | 365ms | 390ms | 480ms | +37% |
| Bluehost | 420ms | 510ms | 680ms | Timeouts | +62%+ |
| HostGator | 480ms | 580ms | 750ms | Timeouts | +56%+ |
| GoDaddy | 510ms | 620ms | 820ms | Timeouts | +61%+ |
Key takeaway from this data: The gap between #1 (ScalaHosting at 28ms) and #12 (GoDaddy at 800ms+) is not marginal. It's a 28x difference in server response time on the same WordPress install. The CPU inside the server explains nearly all of it. Scroll to CPU Rankings to see exactly which processors each host runs.
Table of Contents
- How We Tested 12 WordPress Hosts for Speed (Start Here)
- Quick Picks: Fastest WordPress Hosting 2026
- Speed Comparison: All 12 Fastest WordPress Hosts
- #1. ScalaHosting (28ms TTFB, AMD EPYC 9474F)
- #2. ChemiCloud (189ms TTFB, LiteSpeed Enterprise)
- #3. Cloudways (72ms TTFB, Cloud Infrastructure)
- #4. Kinsta (Google C3D CPUs, Global CDN)
- #5. SiteGround (Good Support, Slow CPUs)
- #6. A2 Hosting (Turbo Speed, PE Owned)
- #7. Hostinger (Budget, CPU Steal Warning)
- #8. Rocket.net (Edge Cache, 2013 Origin CPUs)
- #9. WP Engine (147ms TTFB, Plugin Restrictions)
- #10. Bluehost (680ms TTFB, Newfold Owned)
- #11. HostGator (2012 CPUs, Overloaded Servers)
- #12. GoDaddy (Slowest Tested, 475ms TTFB)
- TTFB Test Snapshots: Visual Proof
- Core Web Vitals: Which Hosts Pass
- Geographic TTFB: Speed by Location
- CPU Rankings: PassMark Data
- WooCommerce Checkout Speed: Tested
- Load Test Results: 10 to 100 Concurrent Users
- Uptime Monitoring: 12-Month Results
- How WordPress Speed Actually Works
- Cache Layer Stack: Why Speed Multiplies
- PHP Workers: The Hidden Bottleneck
- Plugin Impact on TTFB (0 to 30 Plugins Tested)
- Speed Factors Most Hosts Won't Tell You
- How to Speed Up Any WordPress Site (8 Steps)
- Our Take: What the Speed Data Actually Means
- Our Pick: The Fastest WordPress Host in 2026
- FAQ: WordPress Hosting Speed (20 Questions)
#1. ScalaHosting: Fastest WordPress Hosting Overall
Why Scalahosting Wins
- 28ms Average TTFB (Tested Without CDN)
- AMD EPYC 9474F CPUs — Top 3% on PassMark
- SPanel Included Free (Saves ~$15/mo vs cPanel)
- OpenLiteSpeed + LSCache Pre-Configured
- Auto-Healing & SShield (99.998% Attack Block Rate)
- Fully Managed — Real Engineers, Not Script Readers
Honest Downsides
- Renewal price jumps ~200% after first term
- No shared hosting tier — minimum $29.95/mo entry
- Knowledge base needs improvement (not DigitalOcean-level)
Performance Benchmarks
- TTFB: 28ms (VPS cached)
- Load Test (100 Users): 33ms (+18% degradation)
- PHP Workers: 30 (Scalable)

$29.95/mo
Anytime Money Back Guarantee
I'll start with the hardware, because it's what makes ScalaHosting different from every other host under $100/month.
Running lscpu on ScalaHosting's VPS returns AMD EPYC 9474F. On PassMark, that's ranked ~31st out of 1,190 server CPUs with a multithread score of ~102,107. For reference:
- SiteGround uses Intel Xeon Gold 6268CL → PassMark #226, multithread ~21,500 (475% slower)
- WP Engine uses Google C2 / Intel Xeon 6253CL → PassMark #280
- Rocket.net uses Intel Xeon E5-2667 v2 from 2013 → PassMark #433 (480% slower)
- HostGator uses AMD Opteron 6376 from 2012 → PassMark #827
These aren't incremental differences. The gap between #31 and #827 is the gap between a 2024 laptop and a 2005 desktop. Every PHP function call, every MySQL query, every plugin hook runs on this hardware. The CPU determines your TTFB ceiling.
Vlad (ScalaHosting's CTO) confirmed they're also using DDR5 RAM at 4800MHz and PCIe 5.0 NVMe SSDs with 2,457 MB/s read speed. That's the full Gen 4 EPYC stack, not just a fast CPU bolted onto old memory and storage.
Why "Low-Density Nodes" Is the Whole Story
Every shared host packs 200-500 WordPress sites per physical server. ScalaHosting's managed VPS limits how many clients share hardware. The result: your 30 PHP workers aren't fighting with 200 neighbors for CPU time. During my 100-user load test, TTFB only increased from 28ms to 33ms. On Hostinger, the same test pushed TTFB from 145ms to Timeouts. That's the difference low-density makes.
No Hidden VPS Limits: The Key Differentiator
ScalaHosting's official stance: "There are no limits on any of our cloud virtual servers." No CPU steal caps. No disk I/O throttling. No bandwidth limits.
Compare that to:
- Hostinger VPS: CPU steal limits cause measured 90% performance degradation.
- SiteGround Cloud: Undisclosed I/O limits trigger 503 errors. Support blames bots/plugins, never the limit itself.
SPanel vs cPanel: $180/Year Saved + 8x Less RAM
cPanel costs $15-17/month on VPS. SPanel is free. But the performance impact is what most people miss: SPanel requires ~1 CPU core and minimal RAM, while cPanel demands 2+ cores and 2-4GB RAM. On a 4GB VPS, cPanel eats ~800MB. SPanel eats ~100MB. That's 700MB more for PHP workers and MySQL, directly translating to faster page loads.
Load Test: 28ms to 33ms at 100 Users (19% Degradation)
I ran load tests using k6 simulating 10, 25, 50, and 100 concurrent users hitting an uncached WooCommerce product page on a standard WordPress install (12 plugins, WooCommerce active, Astra theme).
Compare that to the best shared host in this test: ChemiCloud went from 189ms to 340ms at 50 users (80% degradation). Hostinger hit timeouts at 50 users. SiteGround's shared plan maxed out at 680ms before returning errors at 75 users. ScalaHosting's degradation is so flat it looks like measurement error — it isn't. It's what 30 dedicated PHP workers on a low-density VPS node actually does.
PHP Workers: 30 Dedicated Processes — What That Means Under Load
ScalaHosting's managed VPS entry plan gives you 30 PHP-FPM workers. That means 30 simultaneous PHP requests can execute at once. Every concurrent visitor beyond that is queued — but the queue is short because each worker completes in 28ms. Shared hosts typically run 2-4 workers shared across hundreds of sites. The checkout registers analogy: 30 dedicated registers vs 2 registers shared with 300 other stores.
| Host | PHP Workers | Shared/Dedicated | TTFB @ 50 Users |
|---|---|---|---|
| ScalaHosting | 30 | Dedicated | 31ms |
| Cloudways | 8 | Dedicated | 98ms |
| Kinsta | 4 | Dedicated | 102ms |
| ChemiCloud | 2-4 | Shared | 340ms |
| SiteGround | 2-4 | Shared | 470ms |
| Hostinger | 2 | Shared | Timeouts |
Pricing: $29.95/mo intro for 4GB RAM managed VPS. Renewal is ~$82/mo. See our best WordPress hosting guide for full pricing analysis, features, and support comparison across all providers.
Strengths & Weaknesses
Strengths
- Best CPU: AMD EPYC 9474F (#31 PassMark). Nothing under $100/mo matches.
- Best stability: 19% TTFB increase at 100 users. Shared hosts degraded 66-232%.
- No hidden limits: No CPU steal, no I/O throttle, no bandwidth caps.
- SPanel: $180/yr saved, 8x less RAM than cPanel.
- Granular scaling: $3/core, $1/GB. Not locked into plans.
- Independent: Not PE-owned. Founded by Chris and Vlad.
- 13 data centers: Sydney, Dallas, NY, Frankfurt, etc.
- SShield: 99.998% attack block rate = less wasted PHP workers on malicious requests.
Weaknesses
- Renewal ~200%: $29.95 intro → ~$82/mo after 1-3 years. Still cheaper than Cloudways/SiteGround Cloud equivalent.
- No shared tier: Minimum $29.95/mo. Budget users → ChemiCloud.
- Support varies: L1 can be hit-or-miss. Senior team is excellent. Ask to escalate.
- Docs are generic: More blog-style than technical reference.
View ScalaHosting WordPress VPS Plans ➦
#2. ChemiCloud: Fastest Shared WordPress Hosting (189ms TTFB)
Chemicloud Strengths
- LiteSpeed Web Server + LSCache on All Plans
- 189ms TTFB — Fastest Shared Hosting Tested
- Free Domain for Life (Not Just 1 Year)
- 11 Global Data Centers
- cPanel Included — No Extra Fee
Chemicloud Weaknesses
- Shared hosting — PHP workers limited to 2-4
- Renewal jumps from $3.95 to $7.95/mo
- Not suited for WooCommerce with 50+ products
$3.95/mo
45-Day Money Back Guarantee
At $3.95/mo, ChemiCloud delivered 189ms TTFB with LiteSpeed Enterprise on all plans. That's faster than SiteGround ($2.99 intro, $17.99 renewal, 247ms TTFB) and close to A2 Hosting's $6.99 Turbo tier.
The hardware: AMD EPYC 9354 CPUs (#62 on PassMark), faster than Hostinger's 9354P (#58) and dramatically faster than SiteGround's Intel Xeon 6268CL (#226). Combined with NVMe SSDs and server-level LSCache integration, ChemiCloud is the fastest shared host I've tested.
Free lifetime domain (not just year 1). cPanel included (no custom panel learning curve). 11 data centers including Sydney. 45-day money-back. This is the host I recommend to family members starting their first WordPress site.
The Support Difference
ChemiCloud's support is genuinely the best I have experienced in shared hosting. Live chat responses in under 2 minutes from people who actually solve problems instead of reading scripts. Their renewal markup is also the lowest among premium shared hosts: $3.95/mo intro goes to $7.95/mo on renewal (2x), compared to SiteGround's 5-6x markup.
Speed Per Dollar: Why ChemiCloud Wins the Value Calculation
That 2x renewal markup is the lowest among premium shared hosts. SiteGround jumps from $2.99 to $17.99 (6x). Hostinger goes from $2.99 to $7.99 but requires a 4-year lock-in for that intro price. ChemiCloud's renewal at $7.95/mo with LiteSpeed Enterprise, AMD EPYC 9354 CPUs, and free lifetime domain is arguably the best value in shared WordPress hosting even after the intro period ends.
PHP Workers: Where Shared Hosting Hits Its Speed Limit
2-4 PHP workers. More than 15 concurrent uncached visitors means queuing. Under 50-user load, TTFB jumped from 189ms to 340ms (+80%). Not catastrophic, but it's the physics of shared hosting. For anything beyond a blog or small business site, you need ScalaHosting's VPS.
The important nuance: with LiteSpeed Cache properly configured (which it is by default on ChemiCloud), most of your visitors hit the cache and never touch PHP workers. The 2-4 worker limit only matters for uncached requests: logged-in users, WooCommerce cart/checkout, admin panel, POST requests, and any page that bypasses cache. A blog with 50,000 monthly visitors and 95% cache hit rate only sends ~2,500 requests to PHP. That's well within ChemiCloud's capability.
Strengths
- LiteSpeed Enterprise on ALL plans.
- 189ms TTFB: fastest shared.
- AMD EPYC 9354 (#62 PassMark).
- Free lifetime domain.
- cPanel + 45-day guarantee.
- Lowest renewal markup (2x vs 6x).
Weaknesses
- 2-4 PHP workers.
- Renewal: $3.95 → $7.95/mo.
- Not for WooCommerce at scale.
- Smaller company, fewer community tutorials.
View ChemiCloud WordPress Plans ➦
#3. Cloudways: 72ms TTFB — Fastest Cloud WordPress Hosting
Cloudways Strengths
- 72ms TTFB on Vultr High Frequency
- 5 Cloud Providers (DO, Vultr, AWS, GCE, Linode)
- Pay-As-You-Go — No Lock-In Contracts
- Object Cache Pro (Redis) Included Free
- 1-Click Server Cloning & Staging
Cloudways Weaknesses
- No email hosting included — need 3rd party
- No cPanel / Plesk — custom panel only
- Vultr HF plans expensive for what you get ($13+ just for 1GB RAM)
- Bought by DigitalOcean — some feature changes post-acquisition
Performance Benchmarks
- TTFB: 72ms avg
- Load Test (100 Users): 98ms (+36%)
- PHP Workers: Depends on server size
$14.00/mo
3-Day Free Trial (No Card Required)
72ms idle TTFB on Vultr High Frequency is the lowest raw idle number in our test. But here is what matters more: WordPress is resource-hungry. Every plugin, every WooCommerce query, every admin operation eats CPU and RAM. Cloudways gives you raw cloud compute power (Vultr, DigitalOcean, AWS, GCE) with a managed WordPress layer on top. Redis Object Cache Pro included free. Pay-as-you-go billing with no lock-in contracts.
The Cloudways approach is fundamentally different from traditional hosting. You're not buying a "WordPress hosting plan." You're provisioning a cloud server and Cloudways adds the management layer: 1-click WordPress install, automated backups, staging per application, SSL management, and server monitoring. This makes it the best choice for developers and agencies who want cloud infrastructure without the overhead of managing it from scratch.
The trade-offs are real. No email hosting means adding $72+/year for Google Workspace or Zoho Mail. No cPanel means learning their custom panel (it's clean but different). Migration costs $50/site unless you do it yourself. And the DigitalOcean acquisition (2022) has raised long-term concerns about independence. Vultr HF 4 cores + 8GB RAM is $118/mo on Cloudways. ScalaHosting's equivalent VPS is ~$36/mo with email + SPanel included.
Cloudways Promo: CLOUDS2022 = $30 Free Credit
Not sure if Cloudways is right? Use promo code CLOUDS2022 to get $30 free hosting credit, enough for ~2 months on the 1GB Vultr plan. Test WordPress performance, staging workflows, and the control panel with zero risk. No credit card required for the first 3 days.
Strengths
- 72ms idle TTFB: fast raw speed.
- Redis Object Cache Pro free.
- Pay-as-you-go, no lock-in.
- 5 cloud providers to choose from.
- WordPress needs resources. Cloudways delivers raw compute.
Weaknesses
- No email, no cPanel, $50 migration.
- ~3x more expensive for equivalent resources.
- DigitalOcean acquisition risk.
- Steep learning curve for beginners.
- Degrades more under load than ScalaHosting.
Try Cloudways Free: Code CLOUDS2022 ($30 Credit) ➦
#4. Kinsta: Google C3D Speed on Managed WordPress (Read Full Review)
Kinsta Strengths
- Google Cloud C3D Instances — Fastest Managed WP Hardware
- 78ms TTFB (Premium Tier Network)
- Best Dashboard in the Industry (MyKinsta)
- Cloudflare Enterprise CDN Included Free
- Auto DB Optimization + Edge Caching
Kinsta Weaknesses
- $35/mo for 1 site / 25k visits — extremely expensive
- No email hosting at all
- No cPanel access — MyKinsta only
- Overage charges: $1 per 1,000 visits above plan
- Cannot install custom server-level plugins (e.g., LiteSpeed)
Performance Benchmarks
- TTFB: 78ms
- Load Test (100 Users): 92ms (rock solid)
- PHP Workers: Auto-scaled

$35.00/mo
30-Day Money Back Guarantee
Kinsta runs on Google Cloud C3D instances, built on Intel Sapphire Rapids processors. That's a significant upgrade from their older C2 setup. Our TTFB result: 78ms from New York, measured at the origin with no CDN active. Under the 100-user load test, Kinsta held steady at 91ms average. Zero errors. That is genuinely impressive stability.
The Cloudflare Enterprise CDN is included on every plan. Most hosts charge extra for enterprise CDN or route you through a lower-tier version. Kinsta's CDN delivers static assets from 260+ PoPs globally, which means your images and CSS load fast everywhere. For a US audience, your WordPress site on Kinsta will load visually fast even if the PHP origin is in a different region.
MyKinsta is the best hosting dashboard I've used. One-click staging, staging-to-production push with a database merge option, built-in APM (application performance monitoring) that shows you exactly which plugin or query is slowing your site, PHP version switching per site, and Redis object cache toggle. These are features you typically configure manually on other platforms.
The economics are the honest problem. $35/mo for 1 site and 25,000 monthly visits. Overage at $1 per 1,000 visits adds up fast if you publish anything that drives traffic. Ten sites costs $350/mo. ScalaHosting's managed VPS at $60/mo handles 30+ sites with faster raw hardware. Kinsta only makes economic sense if you have one or two high-revenue sites and want zero infrastructure management overhead.
There is also no email hosting. You'll need Google Workspace ($6+/mo per user) or Zoho Mail on top.
Kinsta Performance at Price: What 78ms TTFB Costs vs Alternatives
No renewal trap is the good news. The math is still challenging: $35/mo for a single site with a 25,000 visit cap. Overage at $1 per 1,000 visits adds up quickly if you publish anything that drives real traffic. Ten sites costs $350/mo. ScalaHosting's managed VPS at $60/mo handles 30+ sites with faster raw hardware. Kinsta makes economic sense if you have one or two high-revenue sites and want zero infrastructure management overhead. For everyone else, the value doesn't justify the price difference.
Strengths
- 78ms TTFB, 91ms at 100 users. Zero errors under load.
- Google Cloud C3D (Sapphire Rapids). Better than their old C2 setup.
- Cloudflare Enterprise CDN included. No extra charge.
- MyKinsta dashboard + built-in APM. Best devex in managed WP.
- One-click staging with DB merge.
Weaknesses
- $35/mo for 1 site, 25k visits. $1/1k visit overage.
- 10 sites = $350+/mo. ScalaHosting does it for $60.
- No email hosting included.
- Visit limits make traffic spikes expensive.
#5. SiteGround: 247ms TTFB — Why Good Support Can't Fix a Slow CPU (Read Full Review)
Siteground Strengths
- Best WordPress Support in the Industry
- Custom SuperCacher (Static + Dynamic + Memcached)
- Google Cloud Infrastructure
- Free Site Migration
- Automatic WordPress Updates
Siteground Weaknesses
- Renewal: $2.99 → $17.99/mo (500% jump)
- Only 10GB storage on StartUp plan
- TTFB averaged 247ms — slower than ChemiCloud shared
- Custom Site Tools panel — no standard cPanel
- PHP workers capped at 4 on GrowBig plan
Performance Benchmarks
- TTFB: 164ms avg
- CPU: ~226th/1,190 (PassMark)
- I/O Speed: Undisclosed — causes 503s
- PHP Workers: 4 (GrowBig)

$2.99/mo
30-Day Money Back Guarantee
SiteGround's support resolved a PHP memory issue in 3 minutes via chat. Best support experience I've had in shared hosting. WordPress.org still officially recommends them. There is a reason SiteGround has built this reputation: their support team genuinely knows WordPress, and they respond faster than any other shared host in our tests.
But the performance data tells a different story: Intel Xeon Gold 6268CL CPUs (#226 on PassMark) deliver 247ms TTFB. That is slower than ChemiCloud at $3.95/mo. Under load testing, SiteGround degraded to 680ms at just 50 concurrent users and started throwing HTTP errors at 75 users. ChemiCloud, running AMD EPYC 9354 (PassMark #62), handles the same load while staying under 340ms.
Why Intel Xeon 6268CL Creates a 247ms TTFB Ceiling
At $17.99/mo renewal, SiteGround shared hosting costs more than Cloudways entry-level cloud hosting ($14/mo with no renewal increase). ScalaHosting VPS is only $12 more ($29.95/mo) with CPUs that are 475% faster. SiteGround Cloud plans start at $100/mo and have undisclosed I/O limits that cause 503 errors under real traffic. The support is genuinely excellent, but you are paying a premium for support while getting mid-tier hardware.
Strengths
- Best WordPress support: Fast, knowledgeable, human assistance.
- SuperCacher (3-tier): Static + Dynamic + Memcached caching.
- Google Cloud infrastructure: Reliable, global network.
- Automatic WordPress updates: Core + plugin updates handled.
Weaknesses
- 247ms TTFB: Slower than $3.95 ChemiCloud.
- $2.99 → $17.99 renewal: 500% price jump.
- 10GB storage on StartUp: Fill it with a few WooCommerce product images.
- 4 PHP workers on GrowBig: Traffic spikes cause queuing fast.
- Disk I/O throttling on Cloud plans.
#6. A2 Hosting: 195ms TTFB on LiteSpeed Turbo — PE Ownership Risk (Read Full Review)
A2 Hosting Strengths
- LiteSpeed + NVMe SSDs on Turbo Plans
- Up to 20x Faster Marketing Claim (Turbo Boost)
- Free cPanel + Jetpack License
- Anytime Money-Back Guarantee
- Free Site Migration
A2 Hosting Weaknesses
- Turbo speed only on $6.99+ plans — Startup is Apache
- TTFB tested at 219ms — good but not class-leading
- Aggressive upselling during checkout
- Phone support wait times average 15+ minutes
S$8.10/mo
Anytime Money-Back Guarantee
A2 Hosting's Turbo plans deliver 219ms TTFB with LiteSpeed Enterprise and NVMe storage. That is competitive with ChemiCloud at a similar price point. The critical detail: the $2.99/mo Startup plan runs Apache, not LiteSpeed. Apache with WordPress is noticeably slower, especially for logged-in users and WooCommerce. LiteSpeed only kicks in at the Turbo tier ($6.99/mo intro, $12.99/mo renewal).
Under our 50-user concurrent load test, the Turbo plan's TTFB climbed to 380ms, a 73% degradation from idle. That is acceptable but not impressive. ChemiCloud at $3.95/mo handles the same load at 340ms with newer AMD EPYC 9354 processors. The A2 Turbo plan uses older hardware (exact CPU undisclosed post-acquisition), and the performance gap becomes more noticeable as traffic increases.
World Host Group Acquisition: Speed Impact After the Buy
A2 Hosting was acquired by Hosting.com (World Host Group) in 2023. World Host Group is a private equity roll-up that has acquired over 30 hosting brands including Rocket.net, FastComet, HostPapa, and Domains4Less. The playbook is well-documented: acquire brands with established organic traffic, consolidate infrastructure, raise renewal prices, reduce staffing. A2's support response times increased post-acquisition based on community reports on Reddit and hosting forums.
This matters for WordPress hosting specifically because you're trusting a provider with years of content, SEO rankings, and customer data. Migrating a mature WordPress site with custom configurations, staging environments, and email routing is a multi-hour project even when it goes smoothly. Signing a 3-year term with a PE-owned host means betting that the service quality holds for 36 months after the acquisition playbook has started.
A2 Turbo vs Non-Turbo: The LiteSpeed Speed Difference
The checkout flow pre-selects paid add-ons: SiteLock Security ($4.99/mo), SpamExperts ($1.99/mo), CodeGuard Backup ($2.99/mo). Declining everything is straightforward, but the defaults inflate the cart total before you notice. The Startup plan at $2.99/mo looks cheap until you realize it runs Apache (not LiteSpeed) and has a $7.99/mo renewal. The Turbo plan is the only tier worth considering, and at $12.99/mo renewal, it costs more than Cloudways entry-level cloud hosting ($14/mo with no renewal increase and significantly better hardware).
Strengths
- 219ms TTFB on Turbo. Competitive with shared hosting leaders.
- LiteSpeed Enterprise + NVMe on Turbo plans.
- Unlimited websites on Turbo Boost and above.
- Free site migration.
- Anytime money-back guarantee (prorated after 30 days).
Weaknesses
- World Host Group (PE) ownership. Acquired 2023.
- Startup plan is Apache, not LiteSpeed. Misleading Turbo branding.
- Pre-selected checkout add-ons inflate the cart total.
- $12.99/mo Turbo renewal approaches cloud hosting pricing.
- Support quality declined post-acquisition per community reports.
#7. Hostinger: Budget WordPress with CPU Steal Warning (Read Full Review)
Hostinger Strengths
- Cheapest Recognizable WordPress Host
- LiteSpeed + LSCache on All Plans
- AI Website Builder Included
- hPanel — Cleanest Control Panel for Beginners
- Free Domain + SSL
Hostinger Weaknesses
- Shared resources — PHP workers limited to 2
- TTFB averaged 145ms — inconsistent under load
- 4-year lock-in required for cheapest price
- No phone support (chat only)
- CPU throttling on traffic spikes (undisclosed limits)
Performance Benchmarks
- TTFB: 145ms avg
- PHP Workers: 2 (Shared)
$2.99/mo
30-Day Money Back Guarantee
Hostinger is the cheapest recognizable brand in WordPress hosting. LiteSpeed Enterprise, LSCache plugin pre-installed, NVMe storage, and a built-in AI website builder at $2.99/mo intro pricing. hPanel is genuinely the cleanest and most beginner-friendly control panel I have tested. It is better than cPanel for newcomers who want a simple, modern interface without the complexity of traditional hosting panels.
The idle TTFB of 145ms is respectable for shared hosting. What they do not advertise: under concurrent load, that number collapses. In our load test, TTFB went from 145ms to 520ms at 50 concurrent users, a 258% degradation. At 75 users we saw timeouts starting. This is not a fluke. Hostinger shared plans give you only 2 PHP workers. When both workers are busy, every additional request queues. For comparison, ChemiCloud gives you 4 workers on entry plans and ScalaHosting VPS gives you 30+.
PHP Workers: 2 Shared Processes — Why 145ms Becomes 520ms Under Load
Hostinger shared plans run 2 PHP-FPM workers shared across all sites on the server. When both are occupied, new requests queue. At idle (1 visitor), those 2 workers sit ready — hence 145ms. At 50 concurrent uncached visitors, the queue backs up. Our test showed TTFB jumping to 520ms (258% increase). At 75 users: timeouts.
This isn't a Hostinger-specific failure. It's the physics of shared hosting. ChemiCloud hits 340ms at 50 users with 4 workers (still queuing, but shorter). The only way out is dedicated resources: ScalaHosting VPS (30 workers) or Cloudways (8 workers per server).
CPU Steal: The VPS-Level Performance Killer
If you upgrade to Hostinger VPS to escape the shared bottleneck, you hit a different problem. Their own support page acknowledges CPU steal limits on VPS plans. Users on Reddit have documented up to 90% CPU performance degradation during peak hours. Spec sheets look impressive on paper — in practice, CPU steal means your $8/mo VPS runs like a $1 shared plan when neighbors are busy.
ScalaHosting guarantees dedicated CPU cores with no steal. When I run top on their VPS, CPU steal reads 0.0%. On Hostinger VPS, users have reported steal percentages hitting 50-90% under server load. For pricing and features comparison, see our best WordPress hosting guide.
Strengths
- 145ms idle TTFB. Competitive for shared hosting.
- LiteSpeed Enterprise + LSCache pre-installed.
- hPanel is the best beginner control panel we have tested.
- AI website builder included. Useful for non-technical users.
- NVMe storage on all plans.
Weaknesses
- 520ms TTFB at 50 users. 258% degradation under load.
- Only 2 PHP workers. Any concurrent traffic causes queuing.
- $2.99/mo requires 4-year upfront payment.
- 167% renewal increase ($2.99 to $7.99).
- VPS has documented CPU steal. Up to 90% degradation.
- Timeouts at 75 concurrent users.
Our Take on Hostinger: A reasonable choice for personal blogs under 15,000 monthly visitors who will not experience concurrent traffic spikes. The 4-year commitment is the real price of entry. For any site making money, or any WooCommerce store, the 2-worker limit and load degradation make it a risk. ChemiCloud at $2.95/mo gives you LiteSpeed and better load stability with no lock-in trap. See our best cheap web hosting guide for the full budget comparison.
#8. Rocket.net: Edge Cache Hides 2013 Origin Hardware
Rocket.net Strengths
- Cloudflare Enterprise Included (Full-Page Caching)
- Sub-50ms TTFB on Cached Pages
- DDoS Protection + WAF Included
- WordPress Optimized Stack
- Automatic Image Optimization
Rocket.net Weaknesses
- Origin TTFB is ~310ms (average without edge cache)
- Older Intel Xeon CPUs — not AMD EPYC class
- $30/mo for 1 site / 250k visits
- Limited server locations (relies on Cloudflare edge)
- Young company — less track record
Performance Benchmarks
- TTFB: <50ms (edge cached)
- CPU: Intel Xeon E5-2667 v2 (2013 origin)
$30.00/mo
30-Day Money Back Guarantee
Rocket.net's marketing leads with sub-50ms page loads. That number is real, but it only applies to cached static content served from Cloudflare Enterprise edge nodes. Every WordPress page that cannot be cached (WooCommerce checkout, user dashboards, search results, wp-admin) hits the origin server directly. And that origin runs Intel Xeon E5-2667 v2 CPUs from 2013, ranked #433 on PassMark. Origin TTFB: 310ms.
To put that in perspective: ScalaHosting's origin alone delivers 28ms TTFB on AMD EPYC 9474F (PassMark #2). You can add Cloudflare's free tier to any host and get edge caching. What you cannot add is faster origin hardware. Every dynamic WordPress operation (the ones that actually matter for user experience) runs on Rocket.net's decade-old processors.
The pricing compounds the problem. $30/mo for 1 site with 250,000 visits. That is close to Kinsta pricing ($35/mo) but with significantly worse origin hardware. Kinsta runs Google C3D with Intel Sapphire Rapids processors. Rocket.net runs 2013 Xeons. For $30/mo, Cloudways on Vultr High Frequency gives you modern AMD hardware with configurable resources and no visit limits.
Rocket.net is also now a World Host Group property, the same PE roll-up that acquired A2 Hosting and FastComet. The combination of legacy hardware, premium pricing, and PE ownership makes this a difficult recommendation for any WordPress site that depends on dynamic content performance.
Strengths
- Sub-50ms cached TTFB via Cloudflare Enterprise edge.
- Full-page caching handles static content extremely well.
- Simple dashboard. Minimal learning curve.
- Free SSL and CDN included.
Weaknesses
- 310ms origin TTFB. 2013 Intel Xeon E5-2667 v2 hardware.
- Dynamic content is slow. Checkout, search, admin all bypass cache.
- $30/mo for 1 site. Worse hardware than Kinsta at $35/mo.
- World Host Group (PE) ownership.
- 250,000 visit cap on starter. Overage fees apply.
#9. WP Engine: Enterprise Reputation, Outdated Hardware (Read Full Review)
WP Engine built its reputation as the managed WordPress gold standard around 2016-2019. Their staging environments, developer workflows, and enterprise support were genuinely best-in-class at the time. The hardware has not kept pace. Our tests show 295ms TTFB on Google C2 / Intel Xeon 6253CL CPUs (#280 PassMark). That is slower than ChemiCloud's entry shared hosting at $3.95/mo. Paying $20-35/mo for WP Engine and getting worse TTFB than a $4/mo shared host is not a value proposition anyone should accept without understanding what they are actually paying for.
What WP Engine Actually Sells
WP Engine is not selling speed. They are selling managed infrastructure, compliance documentation, and developer tooling. The Genesis Framework and full StudioPress theme library are included free on every plan. SOC 2 Type 2 compliance matters for enterprise clients in regulated industries (healthcare, finance, government contractors). If a client's procurement team requires SOC 2 documentation before signing a hosting contract, WP Engine is one of the few WordPress hosts that can provide it.
Their staging-to-production workflow is genuinely useful for agency work. You can selectively push themes but not database, or database but not uploads. Most other managed WordPress hosts offer staging, but WP Engine's granular push options save significant time on client sites where the production database has diverged from staging.
The Plugin Ban List Problem
WP Engine prohibits a specific list of plugins for performance and security reasons. The banned list includes WP Super Cache, W3 Total Cache, Wordfence Free, and several backup plugins. Their rationale: WP Engine provides these features natively through their platform (built-in caching, their own security scanning, automatic backups). The practical problem: if your WordPress developer has built workflows around Wordfence or a specific caching plugin, you need to find alternatives before migrating. This creates real friction for agencies migrating existing client sites.
WP Engine's 147ms TTFB: Why Premium Price Doesn't Equal Fastest
No renewal trap, which is genuinely good. The problem is what $20/mo buys: 1 site, 25,000 visits, on 2019-era hardware. ScalaHosting at $29.95/mo gives you unlimited sites on AMD EPYC 9474F with 28ms TTFB (10x faster origin). Cloudways at $14/mo on Vultr gives you 72ms TTFB with no visit limits. WP Engine's pricing only makes sense when you factor in the SOC 2 compliance, Genesis ecosystem, and enterprise support. If you do not need those specific things, you are overpaying for slow hardware.
Strengths
- SOC 2 Type 2 compliant. Required for enterprise contracts.
- Genesis Framework + StudioPress themes included free.
- Selective staging push (theme only, DB only, etc.).
- 99.99% uptime. Rock-solid reliability.
- No renewal price increase. Transparent billing.
- Good support quality. Under 10 min for complex questions.
Weaknesses
- 295ms TTFB. Slower than $4/mo ChemiCloud shared hosting.
- Intel Xeon 6253CL (#280 PassMark). 2019 hardware in 2026.
- Plugin ban list. No Wordfence Free, no caching plugins.
- $20/mo for 1 site, 25k visits. Visit-based pricing.
- No email hosting. Need Google Workspace separately.
- No cPanel. Proprietary dashboard only.
#10. Bluehost: WordPress.org Recommended Does Not Mean Fast (Read Full Review)
What Bluehost Gets Right
- WordPress.org Recommended — Official recommendation drives trust (but not speed)
- Free Domain + SSL — Standard inclusions on all plans
- One-Click WordPress Install — Beginner-friendly onboarding process
- 24/7 Phone Support — Accessible for complete beginners
Speed Reality Check
- ~420ms Origin TTFB — Overcrowded shared servers with outdated Intel CPUs
- Newfold Digital Owned — Private equity ownership, declining product quality
- $2.95 → $13.99 Renewal — 374% price jump after intro period
- Aggressive Upselling — Pre-checked add-ons at checkout inflate your bill by $10+/mo
$2.95/mo
30-Day Money Back Guarantee
WordPress.org lists Bluehost as a "recommended" host. That recommendation is a commercial affiliate arrangement, not a performance endorsement. WordPress.org earns revenue when visitors sign up through that link. The recommendation has been there for over a decade and has survived multiple ownership changes, infrastructure downgrades, and consistently poor performance benchmarks from independent reviewers.
Our test data: 380ms TTFB at idle. Under our 50-user concurrent load test, that degraded to 680ms. At 100 concurrent users, 14% of requests failed entirely. These are not edge cases. 100 concurrent users is what a moderately popular blog experiences during a social media share. Apache servers with no LiteSpeed option, undisclosed CPU hardware, and shared resources across hundreds of accounts on the same server.
Bluehost is owned by Newfold Digital (formerly Endurance International Group). Newfold also owns HostGator, Web.com, and dozens of other hosting brands. The pattern across Newfold properties: aggressive intro pricing, significant renewal increases, and infrastructure that has not been meaningfully upgraded in years.
Why WordPress.org Recommended ≠ Fast WordPress (680ms TTFB Proof)
WordPress.org's "recommended" label is a commercial affiliate arrangement. Bluehost pays a commission per signup — the label reflects a business relationship, not performance testing. The data tells a different story: 380ms idle TTFB, 680ms at 50 users, 14% request failure rate at 100 users.
Run curl -o /dev/null -s -w "%{time_starttransfer}" https://yourbluehostsite.com on a fresh WordPress install. You will consistently see 350-450ms. Now run the same on ChemiCloud ($2.95/mo). You will see 170-210ms. The infrastructure difference: Apache vs LiteSpeed Enterprise, Intel Xeon Broadwell-era vs AMD EPYC 9354. Same budget, 2x the speed. For full pricing comparison and features, see our best WordPress hosting comparison.
Strengths
- WordPress.org recommended. Brand recognition for beginners.
- Free domain year 1. Standard industry practice.
- Custom WordPress dashboard. Simplified for beginners.
Weaknesses
- 380ms idle TTFB. 2x slower than ChemiCloud at similar price.
- 14% failure rate at 100 users. Cannot handle moderate traffic.
- Apache only. No LiteSpeed option on any plan.
- Newfold Digital (PE) ownership. Same company as HostGator.
- $2.95 to $11.99 renewal. 306% price increase.
- Pre-selected paid add-ons at checkout.
#11. HostGator: Running 2012 CPUs in 2026
Hostgator's Remaining Advantages
- Unmetered Bandwidth — No data transfer caps on any plan
- 45-Day Money-Back — Longer refund window than most competitors
- cPanel Included — Familiar management interface for experienced users
- Free Domain + SSL — Standard inclusions on all plans
Speed Failures
- ~480ms Origin TTFB — Among the slowest hosts tested, even at idle
- 2012-Era Intel Xeon CPUs — E5-2600 series processors still in production use
- Newfold Digital Owned — Same PE group as Bluehost — declining product
- Apache Web Server — Slowest web server for WordPress in 2026
Performance Benchmarks
- TTFB: 395ms avg
- CPU: #827 / 1,190
$2.75/mo
45-Day Money Back Guarantee
The renewal pricing follows the industry pattern: $3.75/mo intro jumps to $11.95/mo at renewal (219% increase). At $11.95/mo, HostGator costs nearly as much as Cloudways ($14/mo) while delivering hardware that is over a decade older. There is no use case, budget, or scenario where HostGator makes sense for WordPress in 2026.
Strengths
- Brand recognition. Long-established name.
- 45-day money-back guarantee.
- Unmetered bandwidth. On shared plans.
Weaknesses
- 395ms TTFB. 14x slower than ScalaHosting.
- AMD Opteron 6376 from 2012. PassMark #827.
- Apache only. No LiteSpeed on any plan.
- Newfold Digital ownership. No infrastructure reinvestment.
- $3.75 to $11.95 renewal. 219% increase.
- Aggressive checkout upsells.
#12. GoDaddy: World's Biggest Host, Slowest WordPress
Godaddy's Remaining Advantages
- Huge Brand Recognition — Largest hosting brand by market share
- Free Domain + SSL — Standard inclusions on managed plans
- 24/7 Phone Support — Accessible for complete beginners
- Built-in Website Builder — For users who don't want WordPress
Speed Failures
- ~510ms Origin TTFB — Slowest WordPress host we tested
- Overcrowded Economy Servers — 500+ sites per physical server on basic plans
- $5.99 → $11.99 Renewal — Prices double after intro period
- Limited PHP Workers — 1-2 on basic plans, causing immediate queuing

$5.99/mo
30-Day Money Back Guarantee
420ms TTFB at idle. The slowest host on this entire list. Under 50 concurrent users, TTFB degraded to 1.2 seconds. That is not a typo. A WordPress page taking 1.2 seconds just to start sending HTML (before CSS, JavaScript, images, or fonts load) is functionally unusable for anything except the most patient visitors. Google's own research shows 53% of mobile users abandon pages that take longer than 3 seconds to load. A 1.2-second TTFB makes hitting that 3-second threshold nearly impossible.
GoDaddy does not disclose their server hardware specifications. When a hosting company with 20+ million customers refuses to publish CPU models, storage type, or server configurations, the reason is typically that the specs would not survive comparison with competitors. Every other host on this list (including HostGator, which runs 2012 hardware) publishes their server specs. GoDaddy's opacity is a red flag.
The WordPress hosting plans use Apache servers with no LiteSpeed option. The "Managed WordPress" tier adds a CDN layer and some automatic updates, but the origin hardware remains the same. At $5.99/mo intro (renewing at $11.99/mo), GoDaddy's WordPress hosting costs more than ChemiCloud ($3.95/mo) while delivering TTFB that is 2.2x slower.
GoDaddy's genuine strength is domain registration and brand recognition. They are the world's largest domain registrar and their DNS management tools are solid. If you already have domains at GoDaddy, there is no need to transfer them. But point your domain's nameservers to a host with modern hardware for your actual WordPress site. Domain registration and hosting are separate services. You do not need to use GoDaddy hosting just because you bought a domain there.
Strengths
- World's largest domain registrar. Good DNS management.
- Brand recognition. 24/7 phone support available.
- 99.95% uptime. Reliability is acceptable.
Weaknesses
- 420ms idle TTFB. Slowest on this list.
- 1.2s TTFB at 50 users. Functionally unusable under load.
- Undisclosed hardware. Refuses to publish specs.
- Apache only. No LiteSpeed on any plan.
- $5.99 to $11.99 renewal. 100% increase.
- Aggressive upselling across every dashboard interaction.
Hosts Tested But Not Recommended (With Data)
These hosts made it into our test roster but did not make the recommended list. Every reason below is backed by a specific test result or documented ownership issue. No baseless opinions.
The Newfold Digital Problem
The common thread across Bluehost, HostGator, and GoDaddy: they are all Newfold Digital properties. Newfold (formerly Endurance International Group) owns all three. The infrastructure investment across these brands has stagnated. HostGator is still running 2012 AMD Opteron processors. Bluehost's TTFB averaged 680ms under load in our tests. These are not outlier results. They are what happens when a PE portfolio company stops reinvesting in hardware while continuing to collect subscription revenue.
The World Host Group Problem
Rocket.net, A2 Hosting, and FastComet have a different but related problem: they are all now World Host Group properties. FastComet had genuinely good performance before the acquisition. A2's Turbo plans still perform well on benchmarks. But the PE ownership trajectory makes recommending any of them for 3+ year commitments difficult when independent alternatives exist at the same price points.
The Pattern of Private Equity Hosting: These acquisitions follow a predictable path. Year 1: prices and service stay mostly the same (maintaining subscriber base). Year 2: renewal prices increase 20-40%. Year 3: infrastructure investment slows, support staff is reduced. Year 4+: new customer pricing becomes attractive again while existing customers pay inflated rates. The best time to identify this pattern is before you sign a 3-year commitment.
Choosing WordPress hosting based on support quality, pricing, ease of use, or beginner-friendliness? Speed is one factor. For the full buying comparison including support tickets tested, pricing transparency, ownership data, and features, see our best WordPress hosting guide.
What is the fastest hosting for WooCommerce checkout? (Load tested at 100 concurrent users)
Checkout pages cannot be cached. Every add-to-cart, coupon validation, shipping calculation, and payment step hits PHP and MySQL directly. We tested checkout TTFB under simulated concurrent user load on all 12 hosts. Here is what the numbers look like when real money is on the line.
| Test Condition | ScalaHosting | Cloudways (Vultr HF) | Hostinger |
|---|---|---|---|
| Idle TTFB | 28ms | 72ms | 145ms |
| 50 concurrent users | 31ms | 85ms | 280ms |
| 100 concurrent users | 33ms (+18%) | 98ms (+36%) | 520ms (+259%) |
| Error rate at 100 users | 0% | 0% | 3.2% (timeouts) |
ScalaHosting
31ms checkout TTFB at idle, 33ms at 100 concurrent users. That 2ms degradation under full checkout load is the key number. Dedicated VPS resources mean your checkout queue does not grow when a promotion drives traffic. 30+ PHP workers, Redis object cache pre-configured, AMD EPYC 9474F, NVMe storage. Zero errors in our load test. The math on lost revenue at 500ms vs 31ms checkout TTFB justifies the cost immediately for any store generating $3K+/month.
Visit ScalaHosting →Cloudways
89ms checkout TTFB on Vultr HF. 0% error rate at 100 concurrent users. PHP-FPM workers configurable per application, so you can match your worker count to your store's peak concurrent checkout volume. Redis Object Cache Pro included (normally $95/yr). Horizontal scaling when Black Friday hits: add server capacity through the dashboard without migrating. Use code CLOUDS2022 for $30 free credit via our Cloudways promo page.
Visit Cloudways →Kinsta
89ms checkout TTFB. Auto-scaling PHP workers. When your promotional email blast drives 200 simultaneous checkouts, Kinsta's container architecture adds PHP workers automatically without configuration. Built-in APM pinpoints slow checkout queries at the database level. The visit-based pricing is the one watch-out: plan headroom for traffic spikes at 2x your typical checkout volume or you will face overage charges during your highest-revenue moments.
Visit Kinsta →Why Checkout Speed Matters More Than Homepage Speed
Most hosting reviews test homepage TTFB. For WooCommerce, that number is almost irrelevant. Your homepage is cached. Your checkout page is not. Every add-to-cart action, every coupon application, every shipping calculation, and every payment processing step hits PHP and MySQL directly. A host with 50ms cached homepage TTFB and 400ms checkout TTFB will lose you more sales than a host with 100ms cached and 80ms checkout.
The PHP worker count determines how many simultaneous checkouts your store can process. Two PHP workers (Hostinger) means two customers can check out at the same time. Customer three waits. On Black Friday or during a promotional email blast, that queue builds fast. ScalaHosting VPS gives you 30+ workers. Cloudways lets you configure the exact number. Kinsta auto-scales. Shared hosting does not scale at all.
WooCommerce on shared hosting: It works until it does not. Most shared hosts give you 2-4 PHP workers. One customer browsing your store is fine. Three simultaneous checkouts will queue and timeout. If your store has more than 100 orders per month, move to a VPS. The revenue from even a few prevented abandoned carts pays for ScalaHosting's $29.95/mo cost.
Running a WordPress agency or freelance business? Support quality, staging workflows, client handoff, SSH access, and per-site pricing are the key decisions. See the full agency hosting comparison in our best WordPress hosting guide, which covers those buying factors in depth.
Speed Under Traffic: How Each Host Holds Up at Scale
High-traffic means different things. 100,000 monthly visits spread evenly is about 3-4 concurrent users at any moment. 100,000 visits with a spike from a viral post can mean 500 concurrent users in an hour. The hardware and architecture that handles one does not necessarily handle the other. Here is the breakdown by scale.
ScalaHosting
28ms TTFB, 33ms at 100 concurrent users. Zero errors at 100 simultaneous connections. AMD EPYC 9474F CPUs with dedicated resources. This is the most load-stable host we tested. Our test simulated 100 users hitting the homepage and a product page simultaneously for 60 seconds: ScalaHosting's TTFB increased by only 19%. No other host came close to that degradation profile. See also our best VPS guide for scale-up options and our dedicated server guide when you outgrow VPS.
Visit ScalaHosting →Cloudways
When you need more than one VPS can handle, Cloudways on AWS or Google Cloud gives you auto-scaling. Start on a Vultr HF or DigitalOcean server, then migrate to AWS when traffic demands it, all within the same dashboard without reconfiguring WordPress. The bandwidth scaling is particularly important at this tier. Use code CLOUDS2022 via our promo page for $30 free credit to evaluate the platform.
Visit Cloudways →Kinsta
Kinsta handles traffic spikes gracefully because their container architecture scales PHP workers automatically. The Cloudflare Enterprise CDN absorbs most of the load for cacheable content. For a site that regularly spikes from social media or press coverage, Kinsta's infrastructure is genuinely resilient. The visit-based pricing becomes an issue at true viral scale, so make sure your plan's visit limit is 2x your typical traffic before a big launch.
Visit Kinsta →The Traffic Spike Reality Check
Most hosting marketing uses "monthly visits" as the metric. That is misleading for high-traffic planning. What matters is concurrent users during your peak hour. A site with 500,000 monthly visits and even traffic distribution has about 15-20 concurrent users at any time. That same site, if it gets linked on Reddit or Hacker News, can see 500+ concurrent users in a single hour. The first scenario works fine on ScalaHosting's entry VPS. The second scenario requires either massive over-provisioning or auto-scaling capability.
Our load test data shows how hosts respond to traffic spikes. ScalaHosting's TTFB increased only 19% under 100 concurrent users (28ms to 33ms). SiteGround degraded 175% (247ms to 680ms) and started erroring at 75 users. Hostinger degraded 258% (145ms to 520ms). These are not theoretical numbers. They predict exactly what happens when your content goes viral. Pick your host based on the worst traffic scenario you expect, not the average.
For sites above 5 million monthly visits, enterprise traffic, or anything requiring SLAs with guaranteed uptime, look at dedicated infrastructure. Our dedicated hosting guide covers the options at that tier.
Which WordPress hosts had the best uptime over 12 months? (Mar 2025 to Mar 2026)
1-Minute Monitoring Intervals. 12 Hosts. 12 Continuous Months.
UptimeRobot Pro pinged every host every 60 seconds for a full year. No cherry-picked windows, no 30-day snapshots. The data below represents 525,600 data points per host.
| Provider | Uptime % | Total Downtime | Outages | Longest Outage |
|---|---|---|---|---|
| ScalaHosting | 99.993% | 37 min | 3 | 18 min |
| ChemiCloud | 99.987% | 1h 8min | 5 | 22 min |
| Cloudways (Vultr) | 99.982% | 1h 34min | 6 | 31 min |
| Kinsta | 99.991% | 47 min | 4 | 15 min (Cloudflare issue) |
| SiteGround | 99.972% | 2h 27min | 8 | 42 min |
| A2 Hosting | 99.961% | 3h 25min | 11 | 55 min |
| Hostinger | 99.968% | 2h 48min | 9 | 38 min |
| Rocket.net | 99.978% | 1h 55min | 7 | 28 min |
| WP Engine | 99.985% | 1h 19min | 5 | 24 min |
| Bluehost | 99.934% | 5h 46min | 18 | 1h 12min |
| HostGator | 99.921% | 6h 56min | 22 | 1h 38min |
| GoDaddy | 99.928% | 6h 18min | 19 | 1h 25min |
Key Takeaway: ScalaHosting (99.993%) and ChemiCloud (99.987%) had the best uptime among non-premium hosts. Kinsta's single major outage was a Cloudflare connectivity issue, not a server problem. The Newfold-owned hosts (Bluehost, HostGator) recorded the most downtime, consistent with their aging infrastructure.
Load Test Results: 10 to 100 Concurrent Users
Real Traffic Simulation. Cache Disabled. Same WordPress Install.
Loader.io ramped from 10 to 100 concurrent users over 60 seconds. Same WordPress setup, same 12 plugins, cache disabled, US East origin. This is where marketing claims meet physics.
| Provider | 10 Users | 25 Users | 50 Users | 100 Users | Error Rate |
|---|---|---|---|---|---|
| ScalaHosting | 148ms | 153ms | 31ms | 33ms | 0% |
| Cloudways (Vultr HF) | 133ms | 140ms | 152ms | 168ms | 0% |
| Kinsta | 82ms | 85ms | 88ms | 92ms | 0% |
| ChemiCloud | 198ms | 245ms | 340ms | 580ms | 2.1% |
| SiteGround | 255ms | 310ms | 410ms | 650ms | 4.8% |
| A2 Hosting Turbo | 228ms | 290ms | 380ms | 610ms | 3.2% |
| Hostinger | 280ms | 450ms | 520ms | Timeouts | 18.6% |
| Rocket.net (origin) | 315ms | 318ms | 320ms | 325ms | 0.2% |
| WP Engine | 300ms | 320ms | 350ms | 380ms | 1.1% |
| Bluehost | 390ms | 510ms | 720ms | 1.4s | 14.2% |
| HostGator | 400ms | 560ms | 850ms | 2.1s | 22.7% |
| GoDaddy | 430ms | 620ms | 1.2s | 3.4s | 31.5% |
Critical Finding: ScalaHosting maintained sub-175ms response time at 100 concurrent users with 0% error rate. This is what dedicated VPS resources + AMD EPYC 9474F CPUs deliver. Meanwhile, Hostinger (shared hosting) hit timeouts at 100 users. GoDaddy reached 3.4 seconds with a 31.5% error rate. If your WordPress site gets more than 50 concurrent visitors, shared hosting physically cannot handle it.
Why ScalaHosting Is the Fastest Overall (Not Just Cloudways): Cloudways shows 72ms idle TTFB vs ScalaHosting's 28ms. But under real 100-user load, ScalaHosting's TTFB only increased 19% (to 33ms) while maintaining 0% errors. The idle number is a lab metric. The load test number is what your visitors actually experience during traffic spikes. ScalaHosting wins where it matters: under real WordPress traffic.
Every Host We Have Tested (Not Just This Year)
This guide ranks the hosts we tested for the 2026 cohort in depth. But ThatMy.com has reviewed and tracked hosts across many providers over our lifetime. Every one was a paid account, not a press loaner. Many did not make the top list because they failed support, pricing, or load-test benchmarks. We keep them in the database so we can tell you which ones to avoid too. Full list below.
| Host | Rating | Entry Price | Link |
|---|---|---|---|
| ScalaHosting Managed VPS | — | $22/mo | View → |
| Cloudways Managed Cloud | — | $11.00/mo | View → |
| ChemiCloud Shared Hosting | — | $2.99/mo | View → |
| Verpex Hosting | — | $12.00/mo | View → |
| Hostinger VPS | — | $5.99/mo | View → |
| Contabo Cloud VPS | — | $8.49/mo | View → |
| InterServer VPS | — | $6.00/mo | View → |
| Namecheap Hosting | — | $1.98/mo | View → |
| Rocket.net | — | $30.00/mo | View → |
| Kamatera Enterprise | — | $4.00/mo | View → |
| Kinsta Managed WP | — | $35.00/mo | View → |
| WP Engine | — | $20.00/mo | View → |
| Liquid Web | — | $59.00/mo | View → |
| SiteGround Hosting | — | $2.99/mo | View → |
| Bluehost Shared | — | $2.95/mo | View → |
| GoDaddy Hosting | — | $5.99/mo | View → |
| HostGator | — | $2.75/mo | View → |
| InMotion Hosting | — | $2.99/mo | View → |
| Hetzner Cloud | — | $5.49/mo | View → |
| OVHcloud VPS | — | $13.00/mo | View → |
| Vultr Cloud | — | $6.00/mo | View → |
| Linode (Akamai) | — | $5.00/mo | View → |
| DigitalOcean | — | $4.00/mo | View → |
| Flywheel | — | $13.00/mo | View → |
| Shopify | — | $29.00/mo | View → |
| Hostwinds | — | $4.99/mo | View → |
| Hosting.com (Formerly A2) | — | $3.99/mo | View → |
| Hosting.com | — | $3.99/mo | View → |
| FastComet | — | $2.95/mo | View → |
| GreenGeeks | — | $2.95/mo | View → |
| DreamHost Shared Hosting | — | $2.59/mo | View → |
| Vercel Edge Platform | — | $20.00/mo | View → |
| Vodien Web Hosting | — | $10.00/mo | View → |
| Exabytes Hosting | — | $3.99/mo | View → |
| ServerFreak | — | RM 199/yr | View → |
| Shinjiru Offshore | — | $8.95/mo | View → |
| IONOS | — | $2.00/mo | View → |
| HostGator India | — | ₹99/mo | View → |
| MilesWeb | — | ₹40/mo | View → |
| BigRock | — | ₹99/mo | View → |
| Bluehost India | — | ₹199/mo | View → |
| Hostinger — Singapore Data Center | — | S$4.05/mo | View → |
| Cloudways — Singapore Cloud Servers | — | S$19/mo | View → |
| ChemiCloud — Singapore Data Center | — | S$4.30/mo | View → |
| ScalaHosting — Singapore Managed VPS | — | S$40/mo | View → |
| A2 Hosting — Singapore Server | — | S$8.10/mo | View → |
| Exabytes — Singapore Local Host | — | S$5.50/mo | View → |
| Vodien — Singapore Local Alternative | — | S$6.90/mo | View → |
| Nexcess Managed Hosting | — | $21.00/mo | View → |
| HostArmada | — | $2.99/mo | View → |
| AEServer | — | $5.00/mo | View → |
| HostPapa | — | $2.95/mo | View → |
| VentraIP Australia | — | $9.00/mo | View → |
| Neoxea | — | Varies | View → |
| JustHost Shared Hosting | — | $4.95/mo | View → |
| NameHero Web Hosting | — | $2.69/mo | View → |
| iPage Web Hosting | — | $1.99/mo | View → |
| GoogieHost Free Hosting | — | $0.00/mo | View → |
| InfinityFree Hosting | — | $0.00/mo | View → |
Counts update as we test new hosts and retire ones that have been acquired or degraded past usability. Full testing protocol at /how-we-test.
TTFB Test Snapshots: The Proof
Raw WebPageTest Screenshots. No Edits. No Cherry-Picking.
These are representative runs from our February 2026 testing round. Same test location (Dulles, VA), same Chrome version, same WordPress install. The TTFB numbers speak for themselves.
ScalaHosting: 28ms TTFB (WebPageTest, New York)
First Byte: 28ms. Start Render: 312ms. Fully Loaded: 1.1s. Test run from New York (Dulles, VA) on Chrome 121. Notice the flat TTFB consistency across multiple runs. That is what dedicated AMD EPYC resources deliver. No spikes, no outliers.
Cloudways Vultr HF: 72ms TTFB (WebPageTest, New York)
First Byte: 72ms. Start Render: 298ms. Fully Loaded: 1.0s. Marginally faster in idle conditions. But this represents an idle server with zero concurrent load. The advantage narrows significantly under traffic as shown in our load test data above.
Hostinger: 145ms TTFB (WebPageTest, New York)
First Byte: 145ms. Start Render: 485ms. Fully Loaded: 2.3s. Notice the TTFB inconsistency across runs. Shared hosting causes unpredictable response times because you're competing with hundreds of neighbors for CPU time. Under 50 concurrent users, this number hit 520ms.
WordPress Performance Metrics: TTFB, Core Web Vitals, Load Time
Which Numbers Actually Matter? What Hosting Controls vs What You Control.
GTmetrix, Pingdom, Google PageSpeed, WebPageTest all show different numbers because they measure different aspects of performance. Here is what each metric means and which ones hosting actually controls.
TTFB: Time to First Byte
TTFB is the time between sending an HTTP request and receiving the first byte of the response. It's pure server response time. This is what hosting controls. Nothing else affects TTFB: not your theme, not your images, not your CDN. Only the server hardware, PHP execution speed, and database query time.
- Under 200ms: Excellent. Only good VPS/cloud hosts achieve this consistently.
- 200-400ms: Acceptable. Most optimized shared hosts land here.
- 400-800ms: Problematic. User perception research shows visitors notice delays above 400ms.
- Over 800ms: Server bottleneck. No amount of front-end optimization fixes this.
Load Time vs TTFB
Load time (1.2s, 3.5s, etc.) includes everything: TTFB, HTML parsing, CSS rendering, JavaScript execution, image downloads. You can have a 28ms TTFB and a 4-second load time if your images are unoptimized. This is why we measure TTFB separately. TTFB tells you if the server is the problem. Load time tells you if the front end is the problem.
Core Web Vitals: LCP, INP, CLS Scores by Host (12 Hosts Tested)
Google's Ranking Signals, Measured on the Same WordPress Install Across All 12 Hosts
Core Web Vitals are not just speed metrics. They directly affect search ranking. TTFB drives LCP. PHP execution speed drives INP. Here is how each host performs across all three signals.
| Host | TTFB | LCP | FID | CLS | CWV Pass? |
|---|---|---|---|---|---|
| ScalaHosting | 28ms | 1.2s | 12ms | 0.02 | Yes |
| Cloudways | 72ms | 1.4s | 15ms | 0.03 | Yes |
| Kinsta | 78ms | 1.3s | 14ms | 0.02 | Yes |
| Hostinger | 145ms | 1.8s | 18ms | 0.04 | Yes |
| ChemiCloud | 189ms | 2.0s | 16ms | 0.03 | Yes |
| A2 Hosting | 219ms | 2.2s | 22ms | 0.05 | Barely |
| SiteGround | 247ms | 2.3s | 19ms | 0.04 | Marginal |
| Rocket.net (origin) | 310ms | 2.5s | 21ms | 0.03 | No (origin) |
| WP Engine | 350ms | 2.6s | 25ms | 0.04 | No |
| Bluehost | 420ms | 3.1s | 32ms | 0.06 | No |
| HostGator | 480ms | 3.4s | 38ms | 0.07 | No |
| GoDaddy | 510ms | 3.6s | 42ms | 0.08 | No |
Google's Core Web Vitals are three signals used in search ranking:
- LCP (Largest Contentful Paint): How long until the main content loads. Under 2.5s = Good. 2.5-4s = Needs Improvement. Over 4s = Poor. High TTFB directly increases LCP. ScalaHosting's 28ms TTFB makes achieving Good LCP straightforward. GoDaddy's 475ms TTFB makes it a baseline handicap before a single image is downloaded.
- INP (Interaction to Next Paint): How quickly the page responds to clicks and inputs. This measures PHP execution speed for dynamic interactions. Hosts with dedicated PHP workers (ScalaHosting, Kinsta) maintain low INP under concurrent load. Shared hosts with 2 PHP workers (Hostinger) show INP degradation when workers are queued.
- CLS (Cumulative Layout Shift): How stable the page looks as it loads. Hosting has minimal direct effect on CLS. This is mostly a theme and image loading issue.
Key finding: ScalaHosting, ChemiCloud, Cloudways, and Kinsta consistently passed Core Web Vitals on our test install. Bluehost, HostGator, and GoDaddy failed on LCP due to TTFB alone. The server is the first link in the Core Web Vitals chain — if it's slow, everything downstream starts from a deficit.
Which WordPress host is fastest by region? (NA, EU, Asia, AU)
Same Server, Different Continents. Physical Distance Adds Latency.
We tested TTFB from four continents for the top 6 hosts. US servers add 150-200ms to Australian visitor TTFB regardless of hardware quality. A CDN mitigates cached pages — but not dynamic WordPress requests.
| Host | New York | London | Singapore | Avg Spread |
|---|---|---|---|---|
| ScalaHosting (Dallas) | 28ms | 115ms | 198ms | 170ms spread |
| Cloudways Vultr HF (NYC) | 18ms | 82ms | 245ms | 227ms spread |
| Kinsta (Iowa) | 42ms | 95ms | 210ms | 168ms spread |
| ChemiCloud (Chicago) | 52ms | 165ms | 310ms | 258ms spread |
| Rocket.net (edge) | <50ms | <50ms | <50ms | ~0ms (CDN) |
| Rocket.net (origin) | 310ms | 395ms | 520ms | 210ms spread |
| SiteGround (Iowa) | 110ms | 215ms | 380ms | 270ms spread |
| A2 Hosting (Michigan) | 85ms | 195ms | 365ms | 280ms spread |
| Hostinger (US) | 68ms | 182ms | 340ms | 272ms spread |
| Bluehost (Utah) | 180ms | 385ms | 580ms | 400ms spread |
| HostGator (Utah) | 210ms | 420ms | 620ms | 410ms spread |
| GoDaddy (Arizona) | 230ms | 450ms | 650ms | 420ms spread |
Server location matters for visitors far from the origin. A US server adds 160-200ms to Australian visitors' TTFB regardless of hardware quality. The fix is a CDN (Cloudflare or BunnyCDN) — but CDNs only cache static assets and cached pages. Dynamic WordPress requests (WooCommerce, logged-in users) always hit the origin server, so origin location still matters for those.
Cloudways lets you choose your cloud provider region (US, EU, Asia, Australia) from the dashboard. ScalaHosting, Kinsta, and WP Engine all have EU data centers. If more than 40% of your traffic comes from a specific region, consider selecting a server in or near that region.
Speed Factors Most Hosts Will Not Tell You
The 5 Hidden Variables That Determine Your WordPress Speed
Every host claims "blazing fast speeds" and "optimized for WordPress." Here are the specific factors behind that marketing language that most companies will not disclose unless you ask directly. See also our fastest web hosting comparison for cross-platform speed data.
1. CPU Architecture and Server Density
The CPU model your host uses is the primary determinant of PHP execution speed. I've verified through lscpu that hosts running AMD EPYC 9474F deliver 28-30ms TTFB while hosts running Xeon E5-2667 v2 deliver 300-800ms TTFB. The CPU is a 4-6x performance multiplier.
Server density is the second factor. Even the best CPU becomes slow when 500 sites share it. ScalaHosting's managed VPS limits density. Most budget shared hosts don't. You have no way to know how many sites share your server on a shared hosting plan.
2. PHP-FPM Worker Count
PHP workers are the processes that execute your WordPress code. When all workers are busy, new requests queue. On shared hosting, you typically get 2-4 workers shared across all sites on the account. On a VPS, you configure the pool directly. The number of PHP workers determines your concurrent capacity: 4 workers means a maximum of 4 simultaneous PHP requests. WooCommerce checkout requires 2-3 workers per customer.
3. Database Performance (MySQL/MariaDB)
WordPress queries the database for every non-cached page load: posts, options, terms, user data. The speed of that database engine is determined by the underlying storage (NVMe vs SATA SSD vs spinning disk) and whether MariaDB is tuned for WordPress workloads. Hosts that use NVMe storage with InnoDB buffer pool sized appropriately for WordPress see 30-50% faster database query times versus generic configurations.
4. Geographic TTFB Variance
Server location matters for visitors far from the origin. A US server adds 160-200ms to Australian visitors' TTFB regardless of hardware quality. The fix is a CDN (Cloudflare or BunnyCDN). But CDNs only cache static assets and cached pages. Dynamic WordPress requests (WooCommerce, logged-in users) always hit the origin. See the full geographic TTFB data table in our Geographic TTFB section above, which shows NA/EU/Asia/AU latency for the top 6 hosts.
5. HTTP/3 and TLS Handshake Optimization
HTTP/3 reduces connection setup overhead for repeat visitors. QUIC protocol eliminates the TCP handshake penalty. LiteSpeed and NGINX both support HTTP/3 natively. Apache requires additional configuration and often delivers worse HTTP/3 performance. This typically saves 20-50ms on cached page loads, which is meaningful for Google Core Web Vitals.
The Private Equity Problem: Who Owns Your WordPress Host
The Section Most Hosting Review Sites Will Never Write
Writing this section means cutting off affiliate relationships with some of the biggest-paying brands. But knowing who owns your host is as important as knowing what CPU it runs.
Newfold Digital (formerly EIG)
- Bluehost: 380ms TTFB, 14% failure under load.
- HostGator: Running 2012 AMD Opteron CPUs (#827 PassMark).
- Web.com: Domain + hosting bundling.
- HostMonster, iPage, JustHost: Ghost brands.
World Host Group (Hosting.com)
- Rocket.net: Acquired. Origin hardware unchanged (2013 CPUs).
- A2 Hosting: Acquired. Checkout upsells intensified.
- FastComet: Acquired. Service changes ongoing.
- 30+ other brands including HostPapa, Domain.com hosting.
Independently Owned
- ScalaHosting: Founded 2007. No PE history.
- ChemiCloud: Independent. No acquisition plans disclosed.
- Kinsta: VC-backed but operationally independent.
- DreamHost: Employee-owned. Privacy-focused.
The PE Playbook
The pattern is predictable: buy brands with loyal customer bases, cut infrastructure costs to improve margins, raise renewal prices. Users do not notice until performance degrades and support deteriorates. By then, migration is painful. Newfold Digital inherited EIG's reputation and continued the same strategy. HostGator still runs CPUs from over a decade ago. Bluehost's WordPress.org recommendation persists despite below-average performance.
Why Independent Ownership Matters
When ScalaHosting's founders Chris and Vlad decide to upgrade to AMD EPYC 9474F, they are investing in customer infrastructure. When PE firms make decisions, they are optimizing for exit multiples. The incentives are fundamentally different.
ChemiCloud is also independently owned. Both companies appear to have no PE involvement or plans to sell. For a hosting relationship that might last 3-5+ years, this matters more than any other factor.
Which WordPress hosts run the fastest server CPUs? (PassMark cross-reference)
We Verified Every CPU via SSH, Support Tickets, and Public Documentation
The CPU inside your server is the primary determinant of PHP execution speed. Most hosts hide this information. We extracted it from every provider.
| Provider | CPU Model | PassMark Rank | Multithread | Year Released |
|---|---|---|---|---|
| ScalaHosting | AMD EPYC 9474F | #31 | ~102,107 | 2023 |
| Hostinger | AMD EPYC 9354P | #58 | ~66,200 | 2023 |
| ChemiCloud | AMD EPYC 9354 | #62 | ~68,800 | 2023 |
| Namecheap | AMD EPYC 7742 | #71 | ~46,500 | 2019 |
| SiteGround | Intel Xeon 6268CL | #226 | ~21,500 | 2019 |
| WP Engine | Intel Xeon 6253CL | #280 | ~19,800 | 2019 |
| Rocket.net | Intel Xeon E5-2667 v2 | #433 | ~21,300 | 2013 |
| HostGator | AMD Opteron 6376 | #827 | ~8,900 | 2012 |
The gap between ScalaHosting (#31) and HostGator (#827) is not a percentage difference. It is a generational chasm. You wouldn't run a 2026 business on a 2012 laptop. You shouldn't run it on a 2012 server CPU either.
What do WordPress hosts actually charge at renewal? (Year-2 pricing reality)
Intro Prices Are Marketing. Renewal Prices Are Reality.
Every hosting company advertises the monthly rate you pay when you commit to 3 or 4 years upfront. That number is designed to get you through the checkout page. Here is the math they do not show you.
I calculated the actual total over 6 years: one introductory term (3 years at promo rate) plus one renewal term (3 years at full price). This is the real cost of a 6-year hosting relationship with each provider.
| Host | Intro Price | Renewal Price | 3-Year Real Cost | TTFB | TTFB/Dollar (Lower = Better) |
|---|---|---|---|---|---|
| ScalaHosting | $29.95/mo | $29.95/mo | $1,078 | 28ms | 0.026 ms/$ |
| Cloudways | $14/mo | $14/mo | $504 | 72ms | 0.143 ms/$ |
| ChemiCloud | $3.95/mo | $7.95/mo | $238 | 189ms | 0.794 ms/$ |
| Hostinger | $2.99/mo | $7.99/mo | $252 | 145ms | 0.575 ms/$ |
| Kinsta | $35/mo | $35/mo | $1,260 | 78ms | 0.062 ms/$ |
| Rocket.net | $30/mo | $30/mo | $1,080 | 310ms | 0.287 ms/$ |
| A2 Hosting (Turbo) | $6.99/mo | $12.99/mo | $395 | 219ms | 0.554 ms/$ |
| SiteGround | $2.99/mo | $17.99/mo | $576 | 247ms | 0.429 ms/$ |
| WP Engine | $20/mo | $20/mo | $720 | 350ms | 0.486 ms/$ |
| Bluehost | $2.95/mo | $13.99/mo | $432 | 420ms | 0.972 ms/$ |
| HostGator | $5.95/mo | $14.99/mo | $467 | 480ms | 1.028 ms/$ |
| GoDaddy | $5.99/mo | $11.99/mo | $384 | 510ms | 1.328 ms/$ |
The Pricing Bottom Line:
- Honest pricing, no traps: Cloudways and ScalaHosting charge the same rate from month one. No intro discount. No renewal shock. What you see is what you pay.
- Best cheap speed value: ChemiCloud at $3.95/mo intro delivers 189ms TTFB on LiteSpeed Enterprise. GoDaddy at $5.99/mo delivers 475ms TTFB on Apache. The faster host costs less at intro.
- Worst renewal trap: SiteGround's 500% renewal increase takes a $3.99/mo intro to $17.99/mo at renewal. That is $480 over 3 years for 247ms TTFB. ChemiCloud delivers 189ms TTFB for $274 over the same period.
- Hidden lock-in: Hostinger's $2.99/mo requires paying 4 years upfront. You're buying 4 years of a host with 2 PHP workers and 258% TTFB degradation at 50 concurrent users.
Rule of thumb: Hosts with honest flat-rate pricing (Cloudways, ScalaHosting) are more confident in their product because they can't bait-and-switch you at renewal. Hosts with massive intro-to-renewal gaps need the low number to close the sale because the renewal price wouldn't convert.
How WordPress Actually Works Under the Hood
The 11-Step Request Lifecycle. Steps 3-9 Are 100% Controlled by Your Host.
Understanding the WordPress request lifecycle reveals exactly where hosting quality matters. Each step below shows the time cost and which component is responsible.
Understanding the WordPress request lifecycle reveals exactly where hosting quality matters:
- DNS Resolution (5-50ms): Browser looks up your IP. You cannot control this.
- TCP/TLS Handshake (30-100ms): Secure connection established. Closer DCs = faster.
- NGINX/LiteSpeed receives request → passes to PHP-FPM.
- PHP-FPM allocates a PHP worker.
- WordPress core loads (~30-50ms on decent hardware).
- Theme functions.php executes.
- Every active plugin fires its hooks, each adding 5-50ms.
- MySQL queries fire: 20-80 queries per page load. 0.5-5ms each on NVMe. 5-50ms on spinning disks.
- PHP assembles HTML → sends back to web server.
- TTFB: First byte arrives at browser. Steps 3-9 are 100% controlled by your hosting.
- Browser downloads + renders: CSS, JS, images, fonts (200-2000ms).
Steps 3-9 take 50-500ms depending on your host. On ScalaHosting: ~28ms. On HostGator: ~395ms. On GoDaddy: ~420ms. Same WordPress setup. Same plugins. Same theme. The only variable is the server hardware and configuration.
Cache Layer Stack: Why WordPress Speed Multiplies With Each Layer
4 Cache Layers. Each One Eliminates a Different Performance Bottleneck.
Most hosts advertise "caching included." The question is which layers. Page cache alone helps. All four layers together can take a 500ms WordPress site to under 50ms for repeat visitors.
| Host | Browser Cache | CDN / Edge | Full-Page Cache | Object Cache | OPcache |
|---|---|---|---|---|---|
| ScalaHosting | (Add Cloudflare) | LSCache (server) | Redis | Pre-configured | |
| Cloudways | Cloudflare Add-on | Varnish (server) | Redis (free) | Pre-configured | |
| Kinsta | Cloudflare Enterprise | Edge + Server cache | Redis ($100/mo add-on) | Pre-configured | |
| ChemiCloud | Free Cloudflare | LSCache (server) | Memcached (limited) | Pre-configured | |
| Rocket.net | CF Enterprise (full-page) | Edge cache (full-page) | Redis | Pre-configured | |
| SiteGround | Own CDN | SG Optimizer (server) | Memcached (GrowBig+) | Pre-configured | |
| A2 Hosting (Turbo) | Cloudflare (manual) | LSCache (Turbo only) | Turbo plans only | Turbo plans only | |
| Hostinger | Own CDN | LSCache (server) | Not available | Pre-configured | |
| WP Engine | CF Enterprise | EverCache (proprietary) | Add-on cost | Pre-configured | |
| Bluehost | Cloudflare (basic) | Plugin-level only | Not available | Not optimized | |
| HostGator | Cloudflare (basic) | Plugin-level only | Not available | Not optimized | |
| GoDaddy | Basic CDN | Plugin-level only | Not available | Not optimized |
Each cache layer intercepts a different type of request:
- Browser cache: Stores static assets (CSS, JS, images) on the visitor's device. All hosts support this. No server involvement after the first visit.
- CDN/Edge cache: Stores cached pages on edge nodes close to visitors. Cloudflare, BunnyCDN. Eliminates origin server latency for cacheable pages globally. Kinsta and Cloudways include Cloudflare Enterprise. Others require separate CDN setup.
- Full-page cache: Stores the complete HTML output of a WordPress page. LiteSpeed Cache (server-level on LiteSpeed hosts), WP Rocket, or host-native cache. Converts PHP-executed pages into static HTML. The biggest single performance gain for most WordPress sites.
- Object cache (Redis): Caches database query results in memory. Eliminates repeat MySQL queries for posts, options, and user data. Critical for WooCommerce and membership sites where logged-in users bypass page cache. ScalaHosting and Cloudways include Redis. Worth $10-20/mo as a third-party add-on if your host doesn't include it.
- OPcache: Caches compiled PHP bytecode in memory. PHP 8.3 with OPcache enabled is 2-3x faster than PHP 7.4 without it. Every host on this list supports OPcache, but some configure it more aggressively than others.
The multiplier effect: Page cache alone might take your TTFB from 300ms to 80ms for cached pages. Add object cache and OPcache, and your uncached (WooCommerce, logged-in) TTFB drops by another 40-60%. Add CDN and your global visitors see 20-50ms regardless of server location. Each layer compounds the others. ScalaHosting and Kinsta are the only hosts that enable all five layers out of the box.
PHP Workers: Why Your WordPress Site Crashes During Traffic Spikes
The Most Important Hosting Concept That Almost Nobody Explains
PHP workers are to your website what checkout registers are to a store. When all registers are busy, customers queue. When all workers are busy, visitors see 503 errors.
This is the most important WordPress hosting concept that almost no review site explains.
PHP Workers = Your Store's Checkout Registers
Each uncached page request needs one PHP worker (~200-500ms). If all workers are busy, new visitors queue. If the queue is full, they get a 503 error or timeout. Shared hosting: 2-4 workers. ScalaHosting VPS: 30+. This is why shared hosting "crashes" during traffic spikes. The queue fills instantly.
| Host | PHP Workers | Max Concurrent Uncached Visitors | What Happens When Full |
|---|---|---|---|
| ScalaHosting VPS | 30 (scalable) | ~60-120 | Requests queue briefly, then process |
| Cloudways | Server-dependent (configurable) | Varies by server size | Configurable via SSH |
| Kinsta | 4-16 (plan dependent) | ~8-64 | Requests queue, then 502 errors |
| ChemiCloud | 2-4 | ~4-16 | Queue → 503 Service Unavailable |
| SiteGround | 4 (GrowBig) | ~8-16 | Queue → 503 error page |
| Hostinger | 2 | ~4-8 | Immediate queuing → timeouts |
Critical insight: Cached pages don't consume PHP workers. This is why page caching (LiteSpeed Cache, WP Rocket) is essential. It converts dynamic PHP requests into static HTML that bypasses the worker queue entirely.
Plugin Impact on TTFB: 0 to 30 Plugins Tested on 4 Hosts
Every Plugin Adds PHP Execution Time. Some Add More Than Others.
We installed the same set of progressively more plugins on four hosts and measured TTFB at each step. The hardware gap between hosts grows larger as plugin count increases.
| Plugin Count | ScalaHosting VPS | ChemiCloud (Shared) | Hostinger (Shared) | Bluehost (Shared) |
|---|---|---|---|---|
| 0 plugins (bare WP) | 28ms | 189ms | 145ms | 340ms |
| 10 plugins | 31ms | 230ms | 195ms | 480ms |
| 20 plugins | 36ms | 310ms | 290ms | 650ms |
| 30 plugins | 42ms | 445ms | 420ms | 980ms |
| Degradation (0 to 30) | +50% | +135% | +190% | +188% |
The data shows something important: the performance gap between hosts grows as plugins accumulate. With 0 plugins, ScalaHosting is 5x faster than Bluehost. With 30 plugins, it is 23x faster. This is because plugin overhead compounds on slow hardware (each plugin executes PHP in sequence, and slow CPUs execute each step more slowly), while fast hardware (AMD EPYC 9474F) absorbs plugin overhead with minimal degradation.
The practical implication: if you run a real WordPress site with WooCommerce, a form plugin, an SEO plugin, caching, security, a page builder, and a few widgets, you are already at 15-20 plugins. On Bluehost, that costs you 500-650ms of TTFB before any content loads. On ScalaHosting, the same plugin stack adds about 8ms.
Which plugins hurt TTFB the most: Plugins that run on every page load are the highest cost. These include SEO plugins (querying post meta on every page), security plugins with active scanning, analytics plugins with database writes, and heavy page builders with multiple database queries per page. Plugins that only run in the admin panel or on specific pages (WooCommerce cart, membership checks for logged-in users) have lower impact on anonymous visitor TTFB.
How to Speed Up Any WordPress Site (8 Steps, Order of Impact)
8 Steps. Ordered by Impact. Server-Level First, Then Front-End.
Fix them in this order and you will cover 95% of WordPress speed problems. The first three are server-level. The rest are front-end and code-level optimizations.
Upgrade PHP Version
PHP 8.3 is 2-3x faster than PHP 7.4. Zero cost. Under 10 minutes.
HIGH IMPACTEnable Object Cache (Redis)
Reduces DB query time from 47ms to 3ms average on WooCommerce.
HIGH IMPACTFull-Page Cache Plugin
Cached pages skip PHP entirely. No workers consumed, no DB queries.
HIGH IMPACTDatabase Optimization
Reduced a client DB from 840MB to 120MB. 30% faster queries.
MEDIUM IMPACTImage Compression (WebP)
Images are 50-80% of page weight. WebP cuts 25-35% per image.
MEDIUM IMPACTCDN (Cloudflare Free)
Cuts 100-300ms for international visitors. Setup: 10 minutes.
MEDIUM IMPACTPlugin Audit (Under 15)
40-plugin sites added 350-400ms to TTFB from plugin chain alone.
MEDIUM IMPACTDNS TTL Optimization
Set TTL to 86400s for stable sites. Saves 20-50ms for repeat visitors.
MEDIUM IMPACT1. Upgrade Your PHP Version
PHP 8.3 is 2-3x faster than PHP 7.4 for WordPress workloads because of the JIT compiler and opcode improvements. Go to your hosting control panel, switch the PHP version per site, test for plugin compatibility, done. Check plugin compatibility first at php.watch. This is the highest-impact single change you can make with zero cost and under 10 minutes of work.
2. Enable Object Cache (Redis)
WordPress runs 20-80 MySQL queries per page. Object caching stores the results in RAM so MySQL isn't queried again on the next request. On ScalaHosting: one-click Redis via SPanel. On Cloudways: Redis + Object Cache Pro pre-configured free. On ChemiCloud: Redis available on shared plans. Enabling Redis on my test WooCommerce site reduced database query time from 47ms average to 3ms average. That's the single measurement that matters here.
3. Full-Page Cache Plugin
Cached pages skip PHP entirely: no workers consumed, no database queries, just static HTML served from storage. On LiteSpeed hosts: LiteSpeed Cache plugin (free, server-level, the best caching option that exists). On NGINX: WP Rocket ($59/yr) or the built-in FastCGI page cache. On Cloudways: the built-in Varnish + Memcached stack is already pre-configured. Most hosts can cache correctly with zero configuration once you install the matching plugin.
4. Database Optimization
WordPress databases accumulate garbage over time: post revisions (every auto-save creates one), transients (plugin-stored temporary data that's never cleaned), orphaned metadata, and spam comments. On a busy site, the database can balloon to 10x what's actually needed. Use WP-Optimize or Advanced DB Cleaner to run a monthly cleanup. I reduced a client's database from 840MB to 120MB, which reduced query times by about 30%. Also schedule auto-vacuuming: on MariaDB, periodic OPTIMIZE TABLE on wp_posts and wp_postmeta reduces fragmentation.
5. Image Compression (WebP + Lazy Loading)
Images are 50-80% of page weight on most WordPress sites. ShortPixel or Imagify for automatic WebP conversion (WebP files are 25-35% smaller than JPEG). Native browser loading="lazy" attribute on all below-fold images. Set explicit width and height on all images to prevent CLS (Cumulative Layout Shift). These three changes fix the most common Core Web Vitals failures.
6. CDN (Cloudflare Free)
Free Cloudflare proxies your site through 300+ global PoPs, serving static assets (images, CSS, JS) from the location nearest your visitor. This cuts 100-300ms of load time for international visitors without changing your hosting. It also adds DDoS protection and WAF as a side benefit. Setup takes under 10 minutes: change your nameservers and enable "Cloudflare proxy" (the orange cloud). For most WordPress sites, this is the fastest single improvement per minute of effort.
7. Plugin Audit (Target: Under 15 Active)
Every active plugin fires PHP hooks on every page load. Install Query Monitor and check the "Queries by Component" and "Hooks" tabs. Sort by execution time. Any plugin consuming over 10ms of execution time on every page load is a candidate for replacement or removal. I've tested 40-plugin sites where the plugin chain alone added 350-400ms to TTFB. Deactivate anything not actively used. Delete it, don't just deactivate it. Deactivated plugins still add minor filesystem overhead.
8. DNS TTL Optimization
DNS TTL (Time to Live) determines how long your domain's IP address is cached globally. A TTL of 300 seconds (5 minutes) means visitors' browsers re-query DNS frequently. For a stable, non-migrating site, set your A record TTL to 86400 seconds (24 hours). This eliminates DNS lookup time from repeat visitors' connections. Before a planned migration, reduce TTL to 300-600 seconds so the change propagates quickly. After migration, increase it back to 86400. This typically saves 20-50ms for repeat visitors.
These 8 steps address 95% of WordPress speed problems. PHP version, Redis, page cache, database, images, CDN, plugins, DNS. I've taken WooCommerce sites from 4-second load times to under 1.2 seconds implementing these in order on ScalaHosting. The first three are entirely server-side. If those don't move your numbers, your host is the bottleneck, not your WordPress configuration.
What's Your Primary Need? Pick a Winner by Hosting Type
We have covered each use case in depth above. Here is the 60-second version: for each common WordPress buyer profile, here is the host that wins the category on our data, with the one number that matters and a direct link to the pick.
New site, speed-first, tight budget
LiteSpeed Enterprise on AMD EPYC 9354. The only shared host at this price bracket running genuinely modern silicon.
See ChemiCloud data →Store that takes money, needs uncached speed
30+ dedicated PHP workers, Redis included, 0% errors at 100 concurrent checkouts in our test.
See checkout load test →Managing 5+ client sites, need flexibility
Five cloud providers, SSH + Git + WP-CLI, staging per site. No renewal markup, ever.
See Cloudways data →Real concurrent users, spike-prone
Only 19% degradation from idle to 100 concurrent users. Every shared host tested timed out or errored at the same load.
See load-test curves →Best TTFB / $ under $5/mo
The only host in the budget bracket delivering LiteSpeed Enterprise + AMD EPYC. 2x faster than Bluehost at the same price.
See value ranking →One high-revenue site, developer time is the cost
Google C3D hardware, Cloudflare Enterprise CDN, auto-scaling PHP workers, 37 data centres.
See Kinsta data →Our Take: Three Things the Speed Data Keeps Telling Me
My Honest Read on the 2026 WordPress Speed Benchmarks
Not borrowed quotes from nameless "experts". These are the three opinions I would put my own name and reputation behind after running this test for the eighth year in a row. Share them if they land.
Our Pick: The Fastest WordPress Hosting in 2026
I tested 12 providers with the same WordPress install, same 12 plugins, same WooCommerce setup, and same load testing methodology. After 90 days of continuous monitoring plus hardware verification via SSH, the answer isn't a surprise: the hosts that refuse to disclose their CPU models are the ones running hardware from 2012-2016. The hosts that run modern AMD EPYC silicon outperform them by 3-6x at any price point.
Here's the three-tier decision framework I'd use today:
Tier 1: If you're serious about WordPress performance and can spend $20-30/mo
Get ScalaHosting Managed VPS. AMD EPYC 9474F CPUs (PassMark #31 out of 1,190 server CPUs). 28ms TTFB, 33ms at 100 concurrent users. No CPU steal, no I/O throttle. SPanel included (saves $180/yr vs cPanel). Independently owned. For a full breakdown of features, support quality, and pricing across all providers, see our best WordPress hosting guide.
Best for: WooCommerce stores, business sites, agencies, high-traffic blogs, any site where performance drives revenue.
Tier 2: If you're starting out or have a tight budget
Get ChemiCloud at $2.95/mo. AMD EPYC 9354, LiteSpeed Enterprise, 189ms TTFB, free lifetime domain, sub-4-minute support. It's the same server software Kinsta charges $35/mo for, available at $3 because it's shared (not managed VPS). Start here, migrate to ScalaHosting when your traffic or revenue justifies dedicated resources. See our cheap web hosting guide for budget alternatives.
Best for: New bloggers, small business sites, tight budgets, sites under 30,000 monthly visits without WooCommerce.
Tier 3: If you're a developer or agency managing multiple client sites
Get Cloudways on Vultr HF ($14/mo). 72ms TTFB. Five cloud provider options. SSH, Git, WP-CLI, staging per site. Redis Object Cache Pro included free (normally $95/yr). No renewal traps: $14/mo is $14/mo forever. Use code CLOUDS2022 via our Cloudways promo page for $30 free credit to evaluate it before committing. See also our VPS hosting guide for cloud alternatives.
Best for: Developers, agencies managing multiple sites, teams needing cloud flexibility and developer tooling.
What to Avoid (and Why)
- Bluehost and HostGator (Newfold Digital): 380-800ms TTFB, 2012-era CPUs, heavy upselling. ChemiCloud is 3x faster at the same price.
- GoDaddy WordPress hosting: 420ms TTFB, undisclosed hardware, Apache servers. Domain registrar, not a serious hosting platform.
- Rocket.net and FastComet (World Host Group): PE-owned, 2013 origin CPUs (Rocket.net), long-term trajectory is unclear post-acquisition.
- Hostinger for anything making money: 2 PHP workers, 258% TTFB degradation at 50 concurrent users, 4-year lock-in requirement for advertised price. Personal blogs only.
Related Reading:
- Best WordPress Hosting: Full Features, Support and Pricing Comparison
- Fastest Web Hosting: Cross-Platform Speed Comparison (Shared, VPS, Cloud, Static)
- Best VPS Hosting: When to Upgrade from Shared
- Best Unlimited Bandwidth VPS for High-Traffic Sites
- Best Dedicated Hosting for Enterprise Traffic
- Best Cheap Web Hosting (Under $5/mo)
- Cloudways Promo Code (CLOUDS2022 for $30 credit)

FAQ: WordPress Hosting Speed (20 Questions Answered)
What is the fastest WordPress hosting in 2026?
ScalaHosting Managed VPS is the fastest WordPress host we tested in 2026: 28ms TTFB at idle, 33ms at 100 concurrent users, 0% error rate under load. The hardware explanation is straightforward: AMD EPYC 9474F CPUs (3.6GHz base, 4.1GHz boost), NVMe PCIe Gen4 storage, 30+ dedicated PHP workers. Cloudways on Vultr HF came second at 72ms TTFB (also 0% error rate). ChemiCloud led the shared hosting category at 189ms. GoDaddy was last at 475ms idle and 3.4 seconds at 50 concurrent users.
What is a good TTFB for WordPress?
Under 200ms is excellent and rarely achieved on budget shared hosting without a CDN. 200-400ms is acceptable for most use cases. 400-600ms is noticeable to users and will hurt Core Web Vitals LCP scores. Over 600ms is a pure server bottleneck — no front-end optimization fixes this. In our tests across 12 hosts, ScalaHosting hit 28ms, Cloudways 72ms, Kinsta 89ms, ChemiCloud 189ms, SiteGround 247ms, A2 Hosting Turbo 195ms, Hostinger 145ms, Bluehost 380ms, HostGator 410ms, GoDaddy 475ms.
What is TTFB and why does it matter for WordPress?
TTFB (Time to First Byte) is the time between sending an HTTP request and receiving the first byte of the server's response. It measures pure server execution speed: how fast the host can run your PHP, query the database, and return HTML. This is what hosting controls. Google's LCP (Largest Contentful Paint) starts counting from the moment the page load begins, so high TTFB directly costs you Core Web Vitals score. WordPress is PHP-driven, so every dynamic page load involves TTFB. Static pages cached by LiteSpeed Cache or Cloudflare bypass PHP entirely and can show sub-20ms TTFB.
What CPU does my WordPress host use and why does it matter?
WordPress is CPU-bound. Every page request compiles PHP opcodes, runs MySQL queries, and processes template logic. Faster CPU means faster PHP execution, lower TTFB, and better Core Web Vitals. ScalaHosting runs AMD EPYC 9474F (PassMark ~102,000). Cloudways on Vultr HF runs AMD EPYC 7003 (PassMark ~78,000). SiteGround runs Intel Xeon 6268CL (PassMark ~45,000). HostGator is still running 2012 AMD Opteron CPUs (PassMark ~827). The gap between top and bottom is roughly 120x in raw processing power, which maps directly to the TTFB difference we measured (28ms vs 475ms).
How do PHP workers affect WordPress speed?
PHP workers are the parallel processes that execute WordPress PHP code. When all workers are busy, new requests queue. When the queue fills, visitors get 503 errors or timeouts. On shared hosting, you typically share 2-4 workers with hundreds of other sites. On ScalaHosting VPS, you get 30+ dedicated workers. The practical impact: with 2 workers (Hostinger), three simultaneous WooCommerce checkouts will queue the third. With 30 workers (ScalaHosting VPS), thirty concurrent checkouts run in parallel. Our load test shows Hostinger hitting 520ms TTFB at 50 concurrent users and timing out at 100. ScalaHosting stayed at 33ms at 100 users.
LiteSpeed vs NGINX vs Apache for WordPress: which is fastest?
LiteSpeed Enterprise is the fastest for WordPress workloads. It supports LiteSpeed Cache natively at the server level, handles HTTP/3 natively, and reads Apache .htaccess files without conversion. ChemiCloud, ScalaHosting, A2 Turbo, and Hostinger all use LiteSpeed. NGINX is second: event-driven, high concurrency, FastCGI for PHP. Cloudways and Kinsta use NGINX with Redis and Varnish for caching. Apache is the slowest: process-per-connection model, no native WP caching, no HTTP/3. Bluehost, GoDaddy, HostGator, and DreamHost still run Apache. The server software choice alone explains a 2-3x TTFB difference between otherwise similar hosts.
What is object caching and how does it affect WordPress speed?
Object caching (usually Redis) stores database query results in memory so WordPress does not re-execute the same MySQL queries on every page load. Without it, a WooCommerce product page can trigger 80 to 200 MySQL queries. With Redis, repeat queries return in under 1ms instead of 3-8ms each. The cumulative effect: object caching reduces PHP execution time by 30-60% for dynamic pages (logged-in users, WooCommerce, search). ScalaHosting and Cloudways include Redis. ChemiCloud includes it on shared hosting. Kinsta includes it. Bluehost, HostGator, and GoDaddy do not include it — you pay extra or go without.
What are the WordPress caching layers and which hosts include all of them?
There are five caching layers: browser cache (all hosts), CDN/edge cache (Cloudways, Kinsta, Rocket.net include this), full-page cache (LiteSpeed Cache on LiteSpeed hosts, FastCGI cache on NGINX hosts), object cache/Redis (ScalaHosting, Cloudways, ChemiCloud, Kinsta), and OPcache (all serious hosts). The multiplier effect: full-page cache takes a 300ms TTFB to sub-50ms for cached pages. Object cache cuts uncached TTFB by 40-60%. CDN delivers cached pages globally in under 30ms. ScalaHosting and Kinsta are the only two hosts that enable all five layers out of the box without additional configuration.
How does plugin count affect WordPress TTFB?
Every active plugin that runs on page load adds PHP execution time. In our test (same plugins installed progressively from 0 to 30 on the same host), ScalaHosting went from 28ms to 42ms at 30 plugins (50% increase). Bluehost went from 340ms to 980ms (188% increase). The hardware gap widens under plugin load because fast CPUs execute each plugin's PHP faster, while slow CPUs have each plugin waiting longer in the execution queue. If you run WooCommerce, an SEO plugin, a page builder, a security plugin, caching, and a form plugin, you are already at 15-20 plugins. Choose your host based on how it performs with 20 plugins, not with 0.
Shared hosting vs VPS for WordPress speed: what is the actual difference?
Shared hosting means your WordPress PHP processes share CPU, RAM, and PHP workers with hundreds of other sites on the same physical server. VPS gives you dedicated CPU cores and RAM. The speed difference under load is stark. In our tests, shared hosts (ChemiCloud, SiteGround, Hostinger) degraded 135-258% from idle to 50 concurrent users. ScalaHosting VPS degraded only 18% from idle to 100 concurrent users. For a blog under 30,000 monthly visitors with no WooCommerce, good shared hosting (ChemiCloud, SiteGround) is sufficient. For anything generating revenue, running WooCommerce, or expecting traffic spikes, a VPS is the minimum viable configuration.
Why is my WordPress site slow even with caching enabled?
Several reasons. First, check if your cache is actually hitting: use a Chrome incognito tab and look for X-Cache: HIT in response headers. Second, your cache may be invalidating too often (WooCommerce, too many logged-in users, or a poorly configured caching plugin that bypasses on every URL parameter). Third, your uncached pages (WooCommerce checkout, logged-in users) still hit PHP — and if your server's CPU is slow or you have 2 PHP workers, those pages will be slow regardless of caching. Caching only helps anonymous visitors on cacheable pages. It cannot fix a slow CPU for dynamic requests.
What are Core Web Vitals and which WordPress hosts pass them?
Google's three Core Web Vitals: LCP (Largest Contentful Paint, target under 2.5s), INP (Interaction to Next Paint, target under 200ms), and CLS (Cumulative Layout Shift, target under 0.1). Hosting directly controls LCP and INP. High TTFB adds directly to LCP. Slow PHP execution under concurrent load increases INP. In our tests on the same WordPress install: ScalaHosting, ChemiCloud, Cloudways, Kinsta, and Rocket.net all passed LCP. SiteGround was borderline. Bluehost, HostGator, and GoDaddy failed LCP due to TTFB alone. The server is the first variable in the Core Web Vitals chain.
Does server location affect WordPress TTFB?
Yes, significantly. A US East server adds approximately 170ms to a visitor in Sydney and 100ms to a visitor in London, regardless of how fast the hardware is. This is the speed of light through fiber. The fix is either a CDN (which caches your pages globally, but only works for cacheable content) or choosing a server close to your primary audience. Cloudways lets you choose from US, EU, Asia, and Australian data centers. ScalaHosting has US and EU. Kinsta has 37 global locations. If more than 40% of your traffic is from one region, your server should be in or near it.
CDN vs hosting upgrade: which improves WordPress speed more?
They solve different problems. A CDN (Cloudflare, BunnyCDN) delivers cached static files (images, CSS, JS) and cached page HTML from edge servers near your visitors. This helps anonymous visitors hitting cacheable pages and can cut perceived load time by 200-400ms for global visitors. But CDNs do nothing for dynamic pages: WooCommerce checkout, logged-in users, search, and any page with a query parameter often bypass the CDN and hit your origin. Upgrading hosting reduces origin TTFB, which helps all requests including dynamic ones. The correct order: fix the host first (move from Apache shared to LiteSpeed shared or VPS), then add a CDN on top.
What PHP version is fastest for WordPress in 2026?
PHP 8.3 is the fastest option available in 2026. PHP 8.3 includes JIT compilation, improved opcode handling, and function call optimizations that make WordPress workloads 2-3x faster than PHP 7.4. In practice, moving from PHP 7.4 to PHP 8.2 typically reduces TTFB by 15-25% on WordPress. PHP 8.3 adds another 5-8% over 8.2. All hosts on our recommended list support PHP 8.3 with per-site version switching. Check plugin compatibility at php.watch before switching. Most major WordPress plugins have supported PHP 8.x since 2022.
How many PHP workers do I need for a WooCommerce store?
A minimum of 8-16 workers for a store with up to 50 concurrent checkout users. The math: WooCommerce checkout requires 2-3 PHP workers per simultaneous customer (cart update + payment processing + order creation). With 8 workers, you can handle 3-4 simultaneous checkouts. With 30+ workers (ScalaHosting VPS), you handle 10-15 simultaneous checkouts without queuing. On shared hosting with 2 workers (Hostinger), a second customer checking out while one is in progress will queue the third request. During a promotional email blast or Black Friday, that queue fills in seconds. Our checkout TTFB test: ScalaHosting 31ms, Cloudways 89ms, Kinsta 89ms, SiteGround 180ms, Bluehost 510ms.
What is the fastest WooCommerce hosting for checkout TTFB?
ScalaHosting at 31ms checkout TTFB under concurrent load. The technical reasons: dedicated VPS resources (no competing neighbors consuming PHP workers), AMD EPYC 9474F CPUs (fastest single-thread performance we tested), 30+ PHP-FPM workers, Redis object caching pre-configured, NVMe storage for database I/O. Cloudways on Vultr HF came second at 89ms with 0% error rate at 100 concurrent checkout users. Kinsta was third at 89ms with auto-scaling workers. Bluehost averaged 510ms checkout TTFB and hit 14.2% errors at 100 users. Any shared host with 2-4 PHP workers will fail checkout load tests.
How does load testing reveal real WordPress hosting speed?
Idle TTFB tests show what the server can do with one visitor. Load tests reveal what happens with real traffic. We used Loader.io to ramp from 10 to 100 concurrent users over 60 seconds on the same WordPress install across all 12 hosts. The results changed the ranking significantly. Hostinger tested at 145ms idle but hit 520ms at 50 concurrent users and timed out at 100. ScalaHosting tested at 28ms idle and only reached 33ms at 100 concurrent users. Rocket.net's edge network absorbed most of the load. The best idle TTFB does not predict the best load performance. This is why we use load tests, not just single-request benchmarks.
Can I run WordPress on shared hosting with 100,000 monthly visitors?
It depends on traffic distribution. 100,000 visits spread evenly over a month averages 3-4 concurrent users, which good shared hosting handles fine. 100,000 visits with spikes from Reddit, Hacker News, or a viral social post can mean 100-500 concurrent users for a single hour. Most shared hosts fail at 30-50 concurrent users. ChemiCloud hit 2.1% errors at 100 concurrent users. Hostinger timed out completely. SiteGround hit 4.8% errors. If your traffic is predictable and spike-free, ChemiCloud shared hosting is adequate at 100,000 monthly visits. If spikes are possible, use ScalaHosting VPS. It handled 100 concurrent users with 0% errors in our test.
Why does WordPress.org recommend Bluehost if Bluehost is slow?
The recommendation is commercial, not performance-based. Bluehost pays WordPress.org a commission per referral, which is disclosed in WordPress.org's affiliate relationship documentation. The recommendation has not been updated to reflect modern performance standards. Bluehost's TTFB in our 2026 tests averaged 380ms idle and 720ms at 50 concurrent users, with a 14.2% error rate at 100 users. The WordPress.org recommended hosts list also includes SiteGround, DreamHost, and Pressable, which perform significantly better. The list reflects business relationships, not benchmark rankings.
What is the fastest shared WordPress hosting in 2026?
ChemiCloud is the fastest shared WordPress host we tested: 189ms TTFB at idle on LiteSpeed Enterprise with AMD EPYC 9354 CPUs. A2 Hosting Turbo came second at 195ms on LiteSpeed. Hostinger was third at 145ms idle but degraded severely under load (520ms at 50 users, timeouts at 100). The speed gap between LiteSpeed and Apache shared hosts is dramatic. ChemiCloud (LiteSpeed, AMD EPYC) vs Bluehost (Apache, Intel Xeon E5): 189ms vs 380ms on the same WordPress install. If you are on shared hosting, the server software and CPU generation matter more than the brand name on the marketing page.