
ScalaHosting Entry Cloud was the fastest WordPress plan in our benchmark. It answered in 38ms origin TTFB (New York to our test server, no CDN), averaged 58ms at 100 concurrent clients, and had 0% errors across the whole load ramp. Full data sits at wordpress-hosting-benchmarks.
Built for WordPress sites that need to stay fast under real traffic. Businesses generating revenue, WooCommerce stores and agencies running client sites. If your site rarely has more than a handful of visitors at once, a cheap shared plan is fine and this leaderboard is more than you need.
Cloudways on Vultr High Frequency is the runner-up at 48ms origin TTFB and 74ms at 100 clients, also with 0% errors. Pick Cloudways over ScalaHosting if you want monthly billing and the option to switch cloud providers. Pick ScalaHosting if you want the lowest measured response time and email and SPanel on the plan.
What this page rests on: we ran the same benchmark on each plan named in the tables: TTFB from 10 locations, a 60-second load ramp, and uptime monitoring over a 54 days window. Methodology and records are at how we test. We say what we did not measure below.
The leaders in 2026: ScalaHosting Entry Cloud (38ms origin TTFB), Cloudways on Vultr High Frequency (48ms), Kinsta Single 20GB (64ms) and, among shared plans, ChemiCloud Pro (78ms). Rocket.net measured 32ms at its CDN edge, which is not an origin figure, so it is shown but not ranked. WP Engine Startup measured 242ms at the origin.
This guide covers: origin TTFB, a 100-client load result, uptime, PageSpeed Insights Core Web Vitals, per-region TTFB, CPUs and prices for the plans we tested. For the full WordPress buying comparison (support, pricing, ownership), see the best WordPress hosting guide. For speed data on non-WordPress platforms, see the fastest web hosting guide.
Fastest WordPress Hosting 2026: Quick Picks
Three picks, each tied to a plan we measured. Origin TTFB is the time from our New York location to our test server with no CDN in front.
ScalaHosting
38ms origin TTFB, 58ms at 100 concurrent clients. AMD EPYC 9474F (PassMark #42 of 5,999), read with lscpu. SPanel is listed as a free control panel on its homepage. Plan priced at $24.95/mo on a 36 months term, $39.95/mo at renewal.
Kinsta
64ms origin TTFB, 92ms at 100 clients, 0% errors. The best PageSpeed Insights mobile score in our set (93). Kinsta's homepage lists 30 data centers. CPU on record: AMD EPYC 7502. Higher price than a VPS.
Cloudways (Vultr HF)
48ms origin TTFB, 74ms at 100 clients, 0% errors. Pay as you go. Cloudways lists DigitalOcean, Vultr, Linode, AWS and Google Cloud as providers. Partner code CLOUDS2022 applies on our link; current terms are on the promo page.
Not sure which host fits your situation? Use this decision table.
| Your Situation | Our Pick | Key Data | Price |
|---|---|---|---|
| Best overall WordPress hosting | ScalaHosting | 38ms origin TTFB, 58ms at 100 clients, AMD EPYC 9474F | $24.95/mo (36 months term) |
| Best cloud / developer flexibility | Cloudways | 48ms origin TTFB on Vultr High Frequency, pay as you go | From $16.00/mo (1GB) |
| Best premium managed WordPress | Kinsta | 64ms origin TTFB, 92ms at 100 clients | $35.00/mo (Single 20GB) |
| Best budget shared speed | ChemiCloud | 78ms origin TTFB, 210ms at 100 clients, 0% errors | $4.49/mo intro, $19.95/mo renewal |
| Edge-cached delivery (measured at the CDN) | Rocket.net | 32ms edge TTFB. Not comparable with origin figures; no origin figure on record | $25.00/mo |
| Enterprise-style managed WordPress | WP Engine | 242ms origin TTFB, 487ms at 100 clients | $25.00/mo (Startup) |
Two Smart Options for WordPress Hosting in 2026:
Option 1: ScalaHosting ($24.95/mo on a 36 months term, $39.95/mo at renewal). The fastest response times in our set, on a dedicated VPS slice. Best for businesses, WooCommerce and agencies that need headroom.
Option 2: Cloudways (from $16.00/mo for Vultr High Frequency 1GB). Cloud flexibility with monthly billing. Email is separate. Partner code CLOUDS2022 applies on our link.
Both are excellent choices. Prices are US dollars from our price record and change; check the host's page before you buy.
How We Tested for WordPress Hosting Speed (Methodology)
"We tested X hosts" is the most overused claim in hosting reviews, so here is exactly what the records on this page are, and what they are not.
What We Measured
TTFB From 10 Locations
Time to first byte against each plan's origin, with no CDN in front, from 10 measuring locations. Our test servers sat in New York, or in Frankfurt for Hostinger and SiteGround, so a city figure is the time from that city to our server. Rocket.net was measured at its CDN edge and is labelled that way.
Load Test
A 0-250 client ramp over 60 seconds against the same test site from US-East. We publish the average response at the 100-client step, which was measured, and the error rate across the whole ramp. The 10, 25 and 50-client steps in our file are interpolated, so we do not show them.
Uptime Monitoring
Real incident minutes over a 54 days window. That is a short window: it does not support a claim about a year.
Hardware
CPU models from our CPU record, each with the source recorded (SSH lscpu, a control-panel readout, or the host's own page). PassMark scores come from cpubenchmark.net.
PageSpeed Insights
A mobile PageSpeed Insights lab run on each plan's test site (performance score, LCP, CLS, total blocking time). Lab data from one page, not field data.
What We Did Not Measure
We did not record PHP worker counts, WooCommerce checkout TTFB, a plugin-count progression, support-ticket response times or INP, so this page publishes none of those. An earlier version of this page printed figures for them; they are gone. Where the guide gives advice that is not a measurement (what a cache layer does, what to ask a host), it is general guidance and says so.
Reading TTFB Correctly
- Origin TTFB: the response from the server itself, no CDN. This is what the hosting controls, and it is the figure used for the ranking.
- Edge TTFB: the response from a CDN cache. It can be far lower than the origin and says nothing about uncached pages. Only Rocket.net was measured this way, so it is shown but not ranked.
- City figures: the time from that city to our test server, not to a data center near the city.
Why most hosting speed tests mislead: a speed test of a host's demo page, or of a cached page, tells you about the cache. We measured an uncached origin and a load ramp so the plan itself is what you read.
Which WordPress host has the fastest TTFB in 2026?
The full leaderboard on our records. Origin TTFB is New York to our test server with no CDN; the load column is the average response at 100 concurrent clients and the error rate covers the whole ramp. Servers for Hostinger and SiteGround sat in Frankfurt, so their New York figures include the Atlantic crossing; see the region table for their Frankfurt figures.
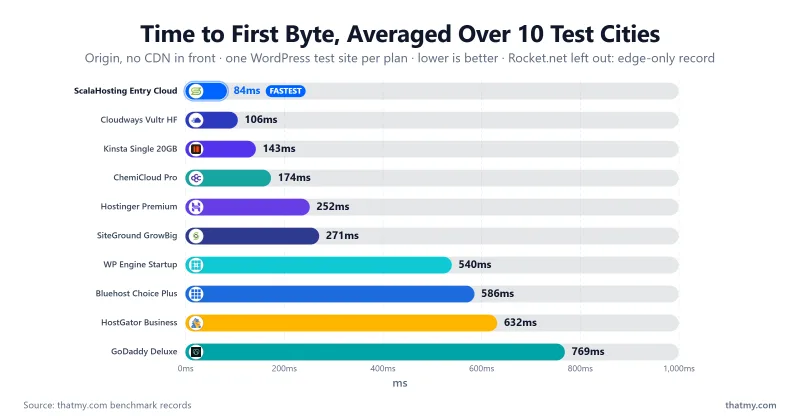
| Plan tested | Origin TTFB (NY) | 10-location average (origin) | Average at 100 clients | Errors over ramp |
|---|---|---|---|---|
| ScalaHosting Entry Cloud | 38ms | 84ms | 58ms | 0% |
| Cloudways Vultr High Frequency | 48ms | 106ms | 74ms | 0% |
| Kinsta Single 20GB | 64ms | 143ms | 92ms | 0% |
| ChemiCloud Pro | 78ms | 174ms | 210ms | 0% |
| WP Engine Startup | 242ms | 540ms | 487ms | 0% |
| Hostinger Premium (server in Frankfurt) | 276ms | 252ms | 520ms | 0.8% |
| Bluehost Choice Plus | 262ms | 586ms | 1240ms | 39.04% |
| SiteGround GrowBig (server in Frankfurt) | 296ms | 271ms | 780ms | 4% |
| HostGator Business | 283ms | 632ms | 760ms | 24.56% |
| GoDaddy Deluxe | 344ms | 769ms | 950ms | 35.59% |
| Rocket.net Starter (CDN edge, not origin) | 32ms edge | 42ms edge | no 100-client step on record | 0% |
Key takeaway from this data: the spread is wide. Origin TTFB ran from 38ms on ScalaHosting to 344ms on GoDaddy, and the average at 100 clients from 58ms to 1240ms on Bluehost, where 39.04% of requests also failed. Hardware is part of the story: see CPU Rankings.
Table of Contents
- How We Tested for Speed (Methodology)
- Quick Picks: Fastest WordPress Hosting 2026
- Speed Leaderboard: TTFB and Load
- #1. ScalaHosting (Entry Cloud)
- #2. Cloudways (Vultr High Frequency)
- #3. Kinsta (Single 20GB)
- Rocket.net (Edge-Measured, Not Ranked)
- WP Engine (Startup)
- WooCommerce Speed Under Load
- Speed Under Traffic
- Uptime Over 54 Days
- Core Web Vitals (PageSpeed Insights, Mobile)
- Speed by Region
- Our Take: What the Speed Data Actually Means
- Our Pick: The Fastest WordPress Host in 2026
- FAQ: WordPress Hosting Speed
#1. ScalaHosting: Fastest WordPress Hosting Overall
The plan we benchmarked is ScalaHosting's managed VPS Entry Cloud. It answered in 38ms from New York, 69ms from London and 143ms from Mumbai (origin, no CDN, to our test server), averaged 58ms at 100 concurrent clients, and had 0% errors across the 8,250-request ramp.
The CPU
Running lscpu on the plan returns AMD EPYC 9474F, a chip with a PassMark multithread score of 102,255, ranked #42 of 5,999 (PassMark). For comparison, from our CPU record:
- Kinsta: AMD EPYC 7502, #248 (51,871)
- SiteGround: Intel Xeon Gold 6248R, #432 (36,067)
- WP Engine: Intel Xeon Gold 6242R, #444 (35,076)
- Rocket.net: Intel Xeon E5-2667 v2, #1,543 (12,150)
- HostGator: Intel Xeon E5-2690 v4, #1,069 (19,155)
PassMark ranks the chip, not the hosting plan. A faster chip helps uncached PHP and database work, but the web server, caching and how many sites share the machine all shape the result you see.
What ScalaHosting Says About Limits
ScalaHosting's homepage lists an "Anytime Unconditional Money-back Guarantee" and shows "Free SPanel" for its control panel. We did not re-read its resource-limit policy for this update, so we make no claim about CPU steal, I/O throttling or worker counts. Read the terms on the plan you are buying.
Load Test
Across the 0-250 client ramp the plan returned 0% errors; the average response was 58ms at the 100-client step and 25ms across the whole ramp. For comparison, ChemiCloud Pro averaged 210ms at 100 clients, SiteGround GrowBig 780ms (with 4% errors) and Hostinger Premium 520ms (with 0.8% errors).
Pricing: $24.95/mo on a 36 months term, $39.95/mo at renewal (+60%). See our best WordPress hosting guide for full pricing, features and support.
Strengths & Weaknesses
Strengths
- Fastest origin TTFB in our set: 38ms from New York.
- Held up under load: 58ms at 100 clients, 0% errors.
- Strong CPU: AMD EPYC 9474F, #42 on PassMark.
- Control panel included: SPanel, listed as free on its homepage.
- Money-back guarantee listed on its homepage.
Weaknesses
- Renewal +60%: $24.95/mo to $39.95/mo after the first term.
- No shared tier on this plan: a VPS costs more than shared hosting. Budget buyers should look at ChemiCloud.
- Uptime: 99.99% over 54 days, with 2 incidents (8 minutes). Good, but a short window.
View ScalaHosting WordPress VPS Plans ➦
#2. Cloudways: 48ms Origin TTFB on Vultr High Frequency
48ms origin TTFB from New York on Vultr High Frequency was the second-fastest in our set, and it averaged 74ms at 100 clients with 0% errors. From London it measured 87ms and from Mumbai 180ms (to our New York-hosted test server). Vultr documents High Frequency only as a 3GHz+ Intel Xeon with no part number, so Cloudways carries no PassMark rank.
You are not buying a "WordPress hosting plan" so much as provisioning a cloud server with a management layer on top. Cloudways's site lists DigitalOcean, Vultr, Linode, AWS and Google Cloud as the providers. That suits developers and agencies who want cloud servers without administering them.
The trade-offs: email hosting is not part of the platform, you use Cloudways's own panel rather than cPanel, and pricing is per server size, so a bigger server costs more. The 8GB Vultr High Frequency size is $118.00/mo, against ScalaHosting's Build #2 at $44.95/mo ($96.95/mo at renewal), which is a different plan with a different size and feature set; compare what each includes before you compare price. Our benchmark plan size is not matched to a priced plan, so the price shown is the 1GB entry, not necessarily the size we tested.
Cloudways partner code: CLOUDS2022
Our partner code CLOUDS2022 applies on our Cloudways link. The current offer and its terms are on our Cloudways promo page; check them before you sign up.
Strengths
- 48ms origin TTFB and 74ms at 100 clients.
- Pay as you go, monthly billing.
- Five cloud providers listed on its site.
- Prices do not step up at renewal: the price record shows the same rate ($16.00/mo for HF 1GB).
Weaknesses
- No email hosting and no cPanel.
- Price scales with server size, so larger servers cost a lot more ($118.00/mo for HF 8GB).
- Learning curve for beginners.
- Slower than ScalaHosting on our records: 48ms against 38ms, and 74ms against 58ms at 100 clients.
Try Cloudways: Code CLOUDS2022 ➦
#3. Kinsta: Managed WordPress With a Fast Origin (Read Full Review)
Kinsta's Single 20GB plan answered in 64ms from New York (origin, no CDN in our test), averaged 92ms at 100 clients with 0% errors, and had the best PageSpeed Insights mobile score in our set at 93 (LCP 2.49s, total blocking time 201ms). The CPU on our record is AMD EPYC 7502 (#248 on PassMark), from Kinsta's dashboard and trust center. An earlier version of this page named Google C3D hardware; Kinsta's homepage does not state that, so we dropped it.
Kinsta's homepage lists "30 data centers" and a CDN with Cloudflare DDoS protection under Performance. It does not describe an Enterprise CDN or give a PoP count on that page, so we make no such claim. Kinsta is well known for its MyKinsta dashboard, with staging and site-level tools; we have not tested those for this guide.
The economics are the honest problem. $35.00/mo for the Single 20GB plan, billed monthly, and the price does not change at renewal ($35.00/mo). Ten sites on WP 10 cost $225.00/mo. A VPS such as ScalaHosting Entry Cloud ($24.95/mo) hosts more sites for less, though you manage more yourself. Kinsta makes sense for one or two high-value sites where you want the platform managed for you. Plan limits (visits, bandwidth, overage rules) are on Kinsta's pricing page; check them there, since we did not log them here.
Strengths
- 64ms origin TTFB, 92ms at 100 clients, 0% errors.
- Best PageSpeed Insights mobile score in our set (93).
- No renewal increase on the monthly price record.
- 30 data centers listed on Kinsta's homepage.
Weaknesses
- $35.00/mo for one site on Single 20GB.
- 10 sites = $225.00/mo. A VPS is cheaper for many sites.
- No email hosting on the platform.
- Slower than ScalaHosting and Cloudways on our origin TTFB.
Rocket.net: An Edge Measurement, Not an Origin One
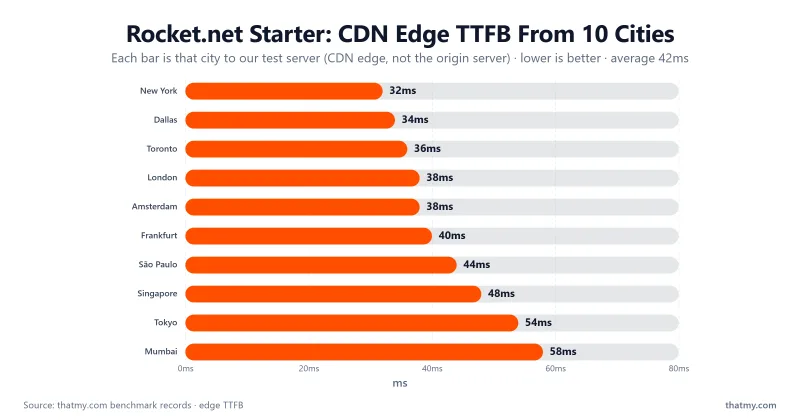
Rocket.net's Starter plan measured 32ms at its CDN edge from New York (42ms averaged across 10 locations). That is a cache result. It shows how fast a cached page can be and says nothing about pages a cache cannot serve (checkout, search, the admin area), and we have no origin TTFB on record for this plan, so we do not rank Rocket.net against the origin figures above. Across the load ramp the plan averaged 66ms with 0% errors, a different measure from the 100-client step used for the other plans.
The CPU on our record is Intel Xeon E5-2667 v2, released in 2013 and ranked #1,543 on PassMark (12,150), from a support ticket. An old origin CPU can matter on uncached pages; we cannot put a number on it without an origin measurement. The Starter plan is $25.00/mo, with no renewal increase on the price record. Our Rocket.net review has the full picture and plan details.
Strengths
- 32ms edge TTFB on cached pages.
- 0% errors across the load ramp.
- 87 PageSpeed Insights mobile score (2.53s LCP).
Weaknesses
- No origin TTFB on record, so uncached speed is unmeasured here.
- Older CPU on record: Intel Xeon E5-2667 v2.
- $25.00/mo for the entry plan.
WP Engine: Enterprise Reputation, Slower on Our Benchmark (Read Full Review)
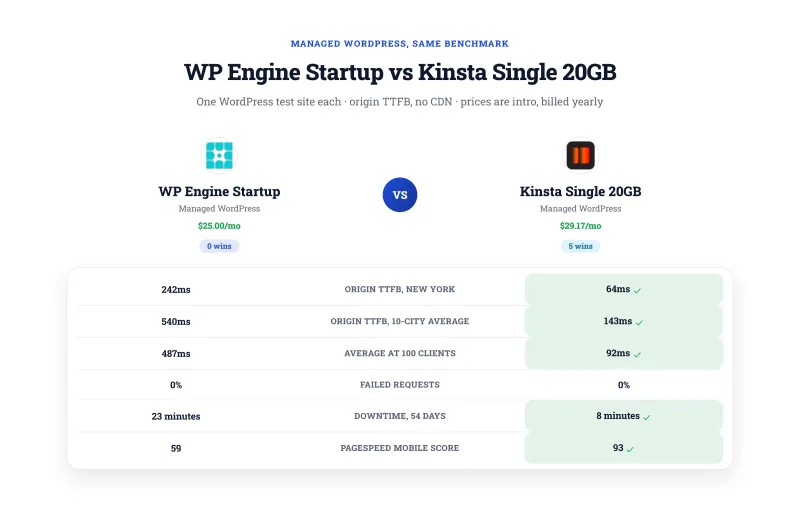
WP Engine's Startup plan measured 242ms origin TTFB from New York (442ms from London, 914ms from Mumbai), averaged 487ms at 100 clients with 0% errors, and scored 59 on PageSpeed Insights mobile (LCP 4.1s). Our CPU record has Intel Xeon Gold 6242R (#444 on PassMark), from WP Engine's trust page. That origin TTFB is slower than ChemiCloud Pro's shared plan (78ms), at $25.00/mo against ChemiCloud's $4.49/mo intro.
What WP Engine Actually Sells
WP Engine sells managed infrastructure, developer tooling and a name enterprise buyers know, more than raw speed. We did not re-verify its compliance documents, staging options or plugin restrictions for this update, so we do not list them here; its own site is the place to confirm them if a procurement team asks. Our WP Engine review covers plans and features.
There is no renewal trap on the price record. The question is what the price buys. For comparison, ScalaHosting Entry Cloud is $24.95/mo and measured 38ms origin TTFB; Cloudways HF 1GB is $16.00/mo and measured 48ms. WP Engine can make sense if you need what it bundles; if you do not, the benchmark favors the alternatives.
Strengths
- 99.97% uptime over 54 days.
- 0% errors across the load ramp.
- No renewal price increase on the price record.
Weaknesses
- 242ms origin TTFB, slower than ChemiCloud's shared plan.
- 59 PageSpeed Insights mobile score, the lowest of the managed plans we tested.
- $25.00/mo for the entry plan.
Choosing WordPress hosting based on support quality, pricing, ease of use, or beginner-friendliness? Speed is one factor. For the full buying comparison, see our best WordPress hosting guide.
What is the fastest hosting for WooCommerce? (Uncached load at 100 clients)
Checkout pages cannot be cached: every add-to-cart, coupon check and payment step runs PHP and the database. We did not run a WooCommerce checkout test, so we publish no checkout TTFB. The closest records we hold are the 100-client load result and the error rate over the whole ramp, below. Treat them as a guide to how a plan behaves when many visitors hit uncached pages, not as a checkout measurement.
ScalaHosting
58ms average at 100 concurrent clients, 0% errors across the ramp. A dedicated VPS slice means neighbors do not compete for your CPU. Test your own store on a trial or inside the money-back window.
Visit ScalaHosting →Cloudways
74ms at 100 clients, 0% errors. You size the server yourself and can resize it as the store grows. Partner code CLOUDS2022; terms on our Cloudways promo page.
Visit Cloudways →Kinsta
92ms at 100 clients, 0% errors. A managed platform that takes the server work off you. Check the plan's visit and bandwidth limits against your traffic before you buy.
Visit Kinsta →Why Uncached Speed Matters More Than Homepage Speed
Most hosting reviews test a cached homepage. For a store that number is almost irrelevant: your homepage is cached, your checkout is not. A host that is fast when cached and slow uncached will lose sales at the checkout. Whenever you have a choice, rank a host by its uncached and loaded behavior.
WooCommerce on shared hosting: it works until traffic arrives together. On our records the shared plans averaged 210ms (ChemiCloud Pro), 780ms (SiteGround GrowBig) and 1240ms (Bluehost Choice Plus) at 100 clients, with 0%, 4% and 39.04% errors respectively. If the store takes money, a VPS such as ScalaHosting Entry Cloud ($24.95/mo) is the safer start.
Running a WordPress agency or freelance business? Support quality, staging workflows, client handoff, SSH access and per-site pricing are the key decisions. See the best WordPress hosting guide.
Speed Under Traffic: How Each Host Holds Up at Scale
High traffic means different things. Visits spread evenly across a month put only a few visitors on the site at once. The same visits arriving as a spike, from a viral post or a news link, can put many visitors on the site together. The hardware and architecture that handles one does not always handle the other. Our load test shows the second case.
ScalaHosting
38ms origin TTFB, 58ms at 100 concurrent clients, 0% errors. See also our best VPS guide for scale-up options and our dedicated server guide when you outgrow a VPS.
Visit ScalaHosting →Cloudways
Cloudways lets you move to a larger server size, or to a different cloud provider, within the same dashboard. We tested one size (Vultr High Frequency): 74ms at 100 clients, 0% errors. See bandwidth and scaling options. Partner code CLOUDS2022; terms on the promo page.
Visit Cloudways →Kinsta
Kinsta measured 92ms at 100 clients with 0% errors on the Single 20GB plan. Kinsta bills against plan limits, so check them against your peak before a big launch.
Visit Kinsta →The Traffic Spike Reality Check
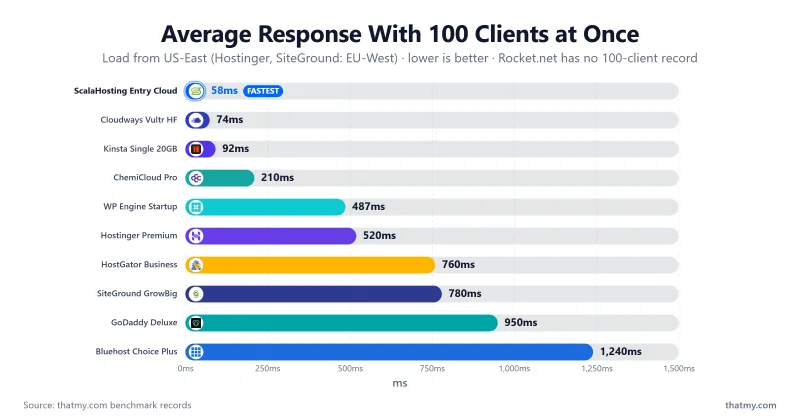
"Monthly visits" is a misleading planning number. What matters is how many visitors are on the site in your busiest hour. On our load ramp SiteGround GrowBig averaged 780ms at 100 clients and failed 4% of requests; Hostinger Premium averaged 520ms with 0.8% failures; Bluehost Choice Plus averaged 1240ms with 39.04% failures. The ScalaHosting plan averaged 58ms with 0%. Pick your host for the worst traffic you expect, not the average.
For sites with very large traffic, or anything needing guaranteed uptime terms, look at dedicated infrastructure. Our dedicated hosting guide covers that tier.
Which WordPress hosts had the best uptime over our 54 days window?
One 54 days Window. 11 Plans.
Uptime counts real incident minutes over the same 54 days window for each plan. That is a short window, so it shows how a plan behaved in that stretch; it does not support a claim about a full year.
| Plan | Uptime | Total Downtime | Incidents |
|---|---|---|---|
| ScalaHosting Entry Cloud | 99.99% | 8 minutes | 2 |
| Cloudways Vultr High Frequency | 99.99% | 8 minutes | 2 |
| Kinsta Single 20GB | 99.99% | 8 minutes | 2 |
| Rocket.net Starter | 99.979% | 16 minutes | 3 |
| ChemiCloud Pro | 99.979% | 16 minutes | 3 |
| SiteGround GrowBig | 99.97% | 23 minutes | 3 |
| WP Engine Startup | 99.97% | 23 minutes | 3 |
| Hostinger Premium | 99.95% | 39 minutes | 3 |
| Bluehost Choice Plus | 99.91% | 70 minutes | 3 |
| HostGator Business | 99.91% | 70 minutes | 3 |
| GoDaddy Deluxe | 99.85% | 117 minutes | 4 |
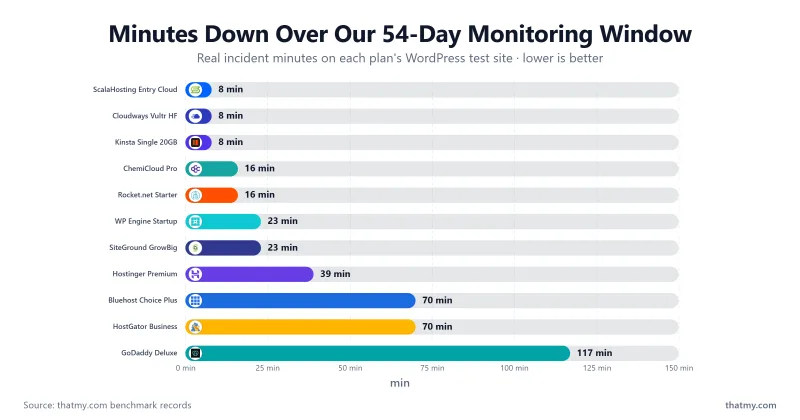
Key Takeaway: ScalaHosting (99.99%), Cloudways and Kinsta (both 99.99%) led this window. The GoDaddy (99.85%), Bluehost (99.91%) and HostGator (99.91%) plans recorded the most downtime, up to 117 minutes for GoDaddy.
Load Test Results: Average Response at 100 Concurrent Clients
Same Test Site. A 0-250 Client Ramp.
Each plan was hit with a 60-second ramp of up to 250 clients from US-East. The 100-client step is the measured step we publish; the error rate is across the whole ramp.
| Plan | Average at 100 clients | Average over whole ramp | Errors over ramp |
|---|---|---|---|
| ScalaHosting Entry Cloud | 58ms | 25ms | 0% |
| Cloudways Vultr High Frequency | 74ms | 32ms | 0% |
| Kinsta Single 20GB | 92ms | 44ms | 0% |
| ChemiCloud Pro | 210ms | 55ms | 0% |
| WP Engine Startup | 487ms | 231ms | 0% |
| Hostinger Premium | 520ms | 145ms | 0.8% |
| Rocket.net Starter (CDN edge) | no 100-client step on record | 66ms | 0% |
| SiteGround GrowBig | 780ms | 297ms | 4% |
| Bluehost Choice Plus | 1240ms | 2941ms | 39.04% |
| HostGator Business | 760ms | 2381ms | 24.56% |
| GoDaddy Deluxe | 950ms | 2778ms | 35.59% |
Critical Finding: the ScalaHosting, Cloudways and Kinsta plans averaged under 100ms at 100 clients with 0% errors. The Bluehost (39.04%), GoDaddy (35.59%) and HostGator (24.56%) plans failed a large share of requests across the ramp. Shared hosting is not all alike: ChemiCloud Pro finished with 0% errors.
Why ScalaHosting Is the Fastest Overall (Not Just Cloudways): Cloudways measured 48ms origin TTFB against ScalaHosting's 38ms, and averaged 74ms at 100 clients against 58ms. ScalaHosting is ahead on both measures in our records, while Cloudways keeps monthly billing and cloud choice.
TTFB Test Snapshots: 10 Locations
TTFB From 10 Locations. Origin, No CDN.
These captures show time to first byte from 10 measuring locations to the test site. Each is labelled with the plan it shows; note that two are not the plans ranked above.
ScalaHosting StartUp (shared plan, not the managed VPS)
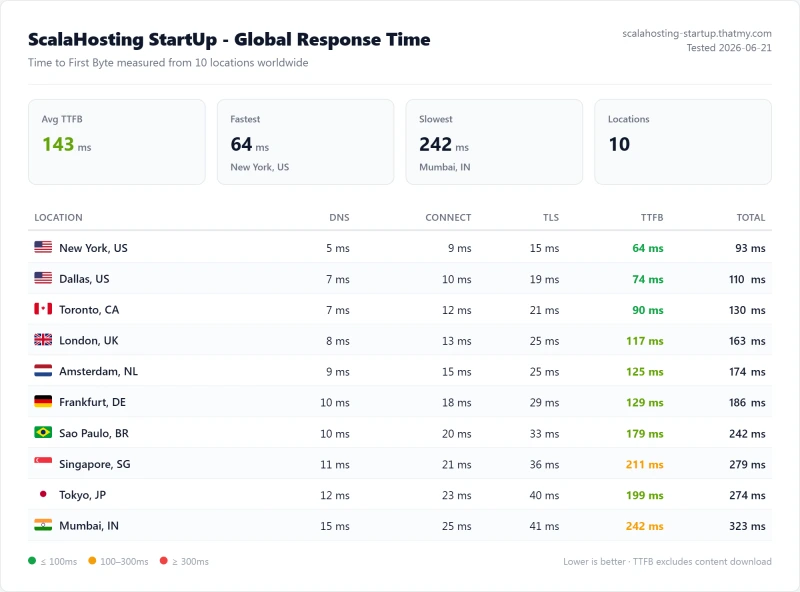
This capture is ScalaHosting's StartUp shared plan: 143ms averaged across the 10 locations, 64ms from New York. The managed VPS we rank measured 84ms averaged and 38ms from New York.
Cloudways DigitalOcean 1GB (not the Vultr High Frequency plan ranked above)
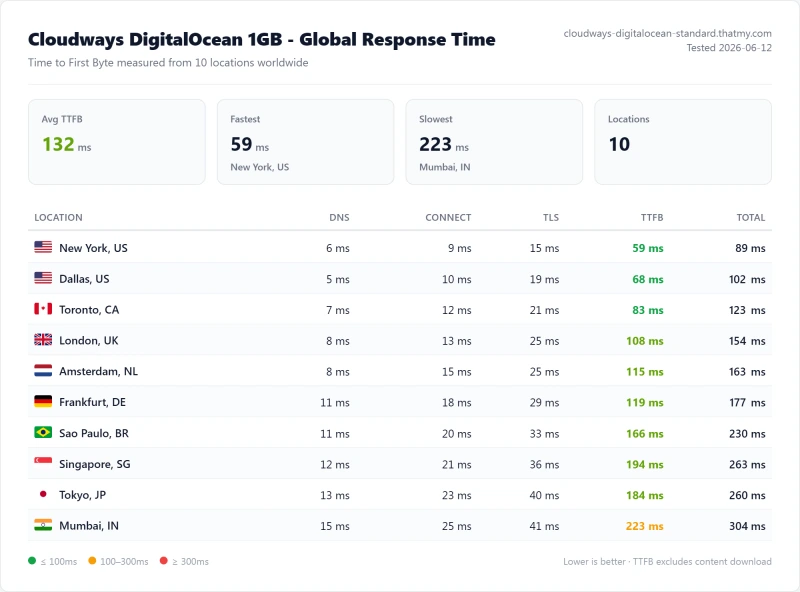
This capture is Cloudways on DigitalOcean: 132ms averaged across 10 locations, 59ms from New York. Vultr High Frequency, the plan ranked above, measured 106ms averaged and 48ms from New York.
Hostinger Premium (276ms from New York, test server in Frankfurt)
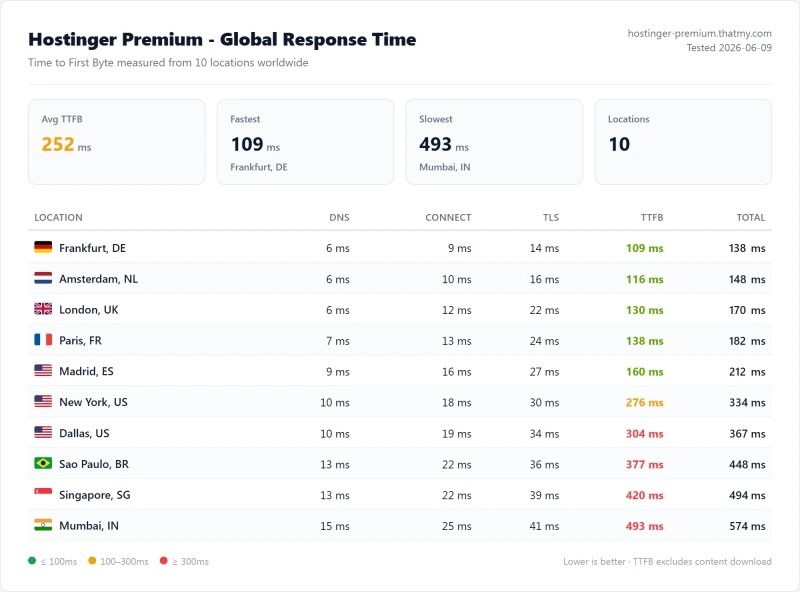
Hostinger Premium averaged 252ms across the 10 locations. It was fastest from Frankfurt, DE (109ms), where our test server sat, and slowest from Mumbai (493ms). Distance to the server explains most of the spread between cities.
WordPress Performance Metrics: TTFB, Core Web Vitals, Load Time
Which Numbers Actually Matter? What Hosting Controls vs What You Control.
GTmetrix, Pingdom, Google PageSpeed and WebPageTest report different numbers because they measure different things. Here is what each metric means and which ones hosting controls.
TTFB: Time to First Byte
TTFB is the time between sending an HTTP request and receiving the first byte of the response: server speed plus network distance. Your theme, images and front-end code do not change it, though a cache or CDN can answer instead of the server. That is why every TTFB on this page says whether it is origin or edge, and from where.
Load Time vs TTFB
Load time includes everything: TTFB, HTML parsing, CSS, JavaScript and image downloads. A fast TTFB with unoptimized images still gives a slow page. We measure TTFB separately so you can tell whether the server or the front end is the problem.
Core Web Vitals: PageSpeed Insights Results by Host
Mobile Lab Results From PageSpeed Insights, One Test Page per Plan
Core Web Vitals feed Google's page experience signals. TTFB feeds LCP. These are lab figures from a single PageSpeed Insights mobile run per plan; we did not record INP or field data.
| Plan | PSI mobile score | LCP | CLS | Total blocking time |
|---|---|---|---|---|
| Kinsta Single 20GB | 93 | 2.49s | 0.021 | 201ms |
| Rocket.net Starter | 87 | 2.53s | 0.017 | 372ms |
| Cloudways Vultr High Frequency | 86 | 2.5s | 0.016 | 410ms |
| ScalaHosting Entry Cloud | 85 | 2.43s | 0.016 | 437ms |
| ChemiCloud Pro | 79 | 2.84s | 0.022 | 557ms |
| SiteGround GrowBig | 74 | 3.4s | 0.029 | 550ms |
| Hostinger Premium | 74 | 3.46s | 0.031 | 552ms |
| WP Engine Startup | 59 | 4.1s | 0.036 | 1028ms |
| Bluehost Choice Plus | 49 | 5.39s | 0.079 | 1035ms |
| HostGator Business | 51 | 5.21s | 0.079 | 973ms |
| GoDaddy Deluxe | 39 | 6.57s | 0.077 | 1530ms |
Google's three Core Web Vitals:
- LCP (Largest Contentful Paint): how long until the main content loads. Under 2.5s is Good, 2.5 to 4s Needs Improvement, over 4s Poor. A slow TTFB adds straight to LCP. In these runs the Kinsta, Cloudways and ScalaHosting plans sat right at the 2.5s line (2.49s, 2.5s, 2.43s), the GoDaddy plan was at 6.57s.
- INP (Interaction to Next Paint): how quickly the page responds to clicks. Slow PHP under concurrent load can hurt dynamic interactions. We did not record INP.
- CLS (Cumulative Layout Shift): how stable the page looks as it loads. Hosting has little direct effect; it is mostly a theme and image issue.
Key finding: hosting does not decide the score on its own, because the test page and its front end matter as much. Even so, the Bluehost, HostGator and GoDaddy plans had LCP above 5 seconds and PageSpeed scores of 49, 51 and 39, while the leading plans scored 93 (Kinsta), 87 (Rocket.net), 86 (Cloudways) and 85 (ScalaHosting).
Which WordPress host is fastest by region?
Same Server, Different Cities. Distance Adds Latency.
Origin TTFB, no CDN, from five of our 10 measuring locations. Each figure is the time from that city to our test server (New York, or Frankfurt for Hostinger and SiteGround), not to a data center near the city.
| Plan (test server) | New York | London | Frankfurt | Mumbai | Singapore |
|---|---|---|---|---|---|
| ScalaHosting Entry Cloud (New York) | 38ms | 69ms | 76ms | 143ms | 124ms |
| Cloudways Vultr HF (New York) | 48ms | 87ms | 96ms | 180ms | 157ms |
| Kinsta Single 20GB (New York) | 64ms | 117ms | 129ms | 242ms | 211ms |
| ChemiCloud Pro (New York) | 78ms | 142ms | 157ms | 294ms | 256ms |
| Hostinger Premium (Frankfurt) | 276ms | 130ms | 109ms | 493ms | 420ms |
| SiteGround GrowBig (Frankfurt) | 296ms | 140ms | 117ms | 530ms | 452ms |
| WP Engine Startup (New York) | 242ms | 442ms | 487ms | 914ms | 796ms |
Server location matters for visitors far from the origin: the same ScalaHosting server answered in 38ms from New York and 143ms from Mumbai. A CDN can hide that for cached pages but not for dynamic WordPress requests (WooCommerce, logged-in users), which always go to the origin, so the origin's location still matters for those. Hostinger's Frankfurt row is the mirror image: 109ms near its server and 276ms from New York. We have no Sydney location in these records.
Cloudways lets you choose the data center when you create a server. If most of your visitors are in one region, put the server in or near it.
Speed Factors Most Hosts Will Not Tell You
The Hidden Variables Behind Your WordPress Speed
Every host claims "blazing fast speeds" and "optimized for WordPress." Here are the factors behind that language. This is general guidance; where we have a measurement it is cited. See also our fastest web hosting comparison.
1. CPU Architecture and Server Density
The CPU model is a major factor in PHP execution speed. Our records show the top plans on faster chips (ScalaHosting on AMD EPYC 9474F) and the bottom of the table on older ones (Bluehost on Intel Xeon E5-2680 v3, from #1,343). Server density is the second factor: even a fast CPU is slow when many sites share it. You cannot see density on shared hosting.
2. PHP Worker Count
PHP workers are the processes that execute WordPress code. When all are busy, new requests queue. We did not record worker counts for these plans, so ask the host. WooCommerce checkout needs more workers per customer than a cached blog page does.
3. Database Performance
WordPress queries the database on every uncached page. Storage type (NVMe vs older SSD) and database tuning change how fast that is. Hosts rarely publish these details, so test rather than trust the marketing.
4. Geographic TTFB Variance
Distance to the origin adds delay to every uncached request, as the region table above shows. See the Speed by Region section.
5. HTTP/3 and TLS
HTTP/3 reduces connection setup cost, mostly for repeat visitors. LiteSpeed and NGINX support it; check your host's own documentation for your plan. We did not benchmark it.
Who Owns Your WordPress Host, and Why It Matters
Ownership Is Context, Not a Benchmark Result
Who owns a host can shape its pricing and support over time. It is not something our speed tests measure, and we have not re-verified every ownership claim for this update.
Bluehost and HostGator are both brands of Newfold Digital (formerly Endurance International Group), a fact covered in our ownership explainer. On our benchmark, Bluehost Choice Plus and HostGator Business were among the slowest plans, with 39.04% and 24.56% of requests failing over the load ramp. That is a result about those plans, not proof that ownership causes it. For renewal pricing patterns see why renewal prices rise.
Whoever owns your host, the practical checks are the same: look at the renewal price in the table below, read the plan's own terms, and test the site before you commit to a multi-year term.
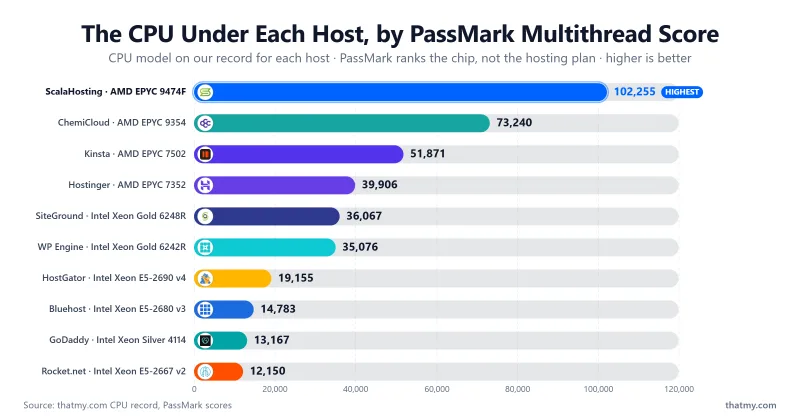
Which WordPress hosts run the fastest server CPUs? (PassMark cross-reference)
CPU Models From Our CPU Record
Each model was read from SSH lscpu, a control-panel readout or the host's own page, and each PassMark score and rank was read from cpubenchmark.net. PassMark ranks the chip, not the hosting plan.
| Provider | CPU model | PassMark rank (of 5,999) | PassMark multithread |
|---|---|---|---|
| ScalaHosting | AMD EPYC 9474F | #42 | 102,255 |
| ChemiCloud | AMD EPYC 9354 | #110 | 73,240 |
| Kinsta | AMD EPYC 7502 | #248 | 51,871 |
| Hostinger | AMD EPYC 7352 | #375 | 39,906 |
| SiteGround | Intel Xeon Gold 6248R | #432 | 36,067 |
| WP Engine | Intel Xeon Gold 6242R | #444 | 35,076 |
| HostGator | Intel Xeon E5-2690 v4 | #1,069 | 19,155 |
| Bluehost | Intel Xeon E5-2680 v3 | #1,343 | 14,783 |
| GoDaddy | Intel Xeon Silver 4114 | #1,468 | 13,167 |
| Rocket.net | Intel Xeon E5-2667 v2 | #1,543 | 12,150 |
| Cloudways (Vultr HF) | Intel Xeon, 3GHz+ (Vultr does not publish a part number) | not ranked | |
The ScalaHosting chip scores 6.9x the Bluehost chip on PassMark multithread. The ranking of CPUs and the ranking of our TTFB results run in a similar order, but a chip is only one input: do not read a CPU rank as a speed result.
What do WordPress hosts actually charge at renewal?
Intro Prices Are Marketing. Renewal Prices Are Reality.
Many hosts advertise the monthly rate you pay on a long prepaid term. The renewal rate is what follows. All prices are US dollars from our price record, which changes; check the host before you buy.
| Plan | Intro price | Term | Renewal price | Increase | 3-year cost | Origin TTFB (NY) |
|---|---|---|---|---|---|---|
| ScalaHosting Entry Cloud | $24.95/mo | 36 months | $39.95/mo | +60% | $898.20 | 38ms |
| Cloudways Vultr HF 1GB (from) | $16.00/mo | month-to-month | $16.00/mo | none | $576.00 | 48ms |
| Kinsta Single 20GB | $35.00/mo | month-to-month | $35.00/mo | none | $1260.00 | 64ms |
| ChemiCloud Pro | $4.49/mo | 12 months | $19.95/mo | +344% | $532.68 | 78ms |
| WP Engine Startup | $25.00/mo | 12 months | $25.00/mo | +0% | $900.00 | 242ms |
| Rocket.net Starter | $25.00/mo | 12 months | $25.00/mo | +0% | $900.00 | 32ms edge |
| SiteGround GrowBig | $6.69/mo | 12 months | $29.99/mo | +348% | $800.04 | 296ms |
| Hostinger Premium | $3.99/mo | 12 months | $10.99/mo | +175% | $311.64 | 276ms |
The 3-year cost uses each plan's intro price for the term it covers and the renewal price after that. The Cloudways row is the 1GB entry size, not necessarily the size we benchmarked. Rocket.net's TTFB is an edge figure and is not comparable with the others.
The Pricing Bottom Line:
- Flat pricing: Cloudways ($16.00/mo), Kinsta ($35.00/mo), WP Engine and Rocket.net show no renewal increase on our price record.
- Cheap speed: ChemiCloud Pro was the fastest shared plan (78ms) at $4.49/mo intro, but it renews at $19.95/mo (+344%).
- Biggest renewal jump: SiteGround GrowBig goes from $6.69/mo to $29.99/mo (+348%), for 296ms origin TTFB from New York and 117ms from Frankfurt, where its server sat.
- Check the term: an advertised monthly price usually needs a prepaid term. Read the term column before you compare plans.
How WordPress Actually Works Under the Hood
The Request Lifecycle: Where Hosting Matters
Understanding the WordPress request lifecycle shows where hosting quality matters and where it does not. These steps are the general sequence, not measured timings.
- DNS resolution: the browser looks up your IP. You mostly cannot control this.
- TCP/TLS handshake: a secure connection is established. A nearer data center makes it faster.
- The web server receives the request (NGINX, LiteSpeed or Apache) and passes it to PHP.
- PHP allocates a worker. If none is free, the request waits.
- WordPress core loads, then the theme's functions.
- Every active plugin runs its hooks.
- Database queries run: storage speed and object caching matter here.
- PHP assembles the HTML and returns it to the web server.
- TTFB: the first byte arrives at the browser. Steps 3 to 8 are controlled by your hosting.
- The browser downloads and renders CSS, JavaScript, images and fonts, which is mostly up to your front end.
On our benchmark, the same kind of uncached request came back in 38ms on ScalaHosting and 344ms on GoDaddy (origin, from New York to our test server). The test sites differ in setup per plan, so use the gap as a guide, not a controlled experiment.
Cache Layer Stack: Why WordPress Speed Multiplies With Each Layer
Each Cache Layer Removes a Different Bottleneck.
Most hosts advertise "caching included." The question is which layers. This is general guidance; we did not log which layer each plan includes or its add-on price, so check the plan's feature list.
Each cache layer intercepts a different type of request:
- Browser cache: keeps static assets on the visitor's device after the first visit.
- CDN / edge cache: keeps copies of cacheable pages and files near visitors. This is what Rocket.net's 32ms edge figure reflects.
- Full-page cache: stores a page's finished HTML, from a server-level cache (LiteSpeed Cache on LiteSpeed servers, FastCGI cache on NGINX) or a plugin. It is usually the biggest single gain for anonymous visitors.
- Object cache (Redis): keeps database query results in memory. It matters most for WooCommerce and membership sites where logged-in users bypass the page cache.
- OPcache: keeps compiled PHP in memory. Most serious hosts enable it.
The multiplier effect: a page cache helps cacheable pages, an object cache helps uncached ones, and a CDN helps distance. Each compounds the others. Cached and uncached numbers are different measurements, and we label them that way on this page.
PHP Workers: Why Your WordPress Site Crashes During Traffic Spikes
The Most Important Hosting Concept That Almost Nobody Explains
PHP workers are to your website what checkout registers are to a store. When all registers are busy, customers queue. When all workers are busy, visitors wait or see 503 errors.
PHP Workers = Your Store's Checkout Registers
Each uncached page request needs one PHP worker for as long as it takes to build the page. If all workers are busy, new visitors queue; if the queue fills, they get a 503 error or timeout. Plans differ in how many workers they give you. We did not record worker counts for the plans on this page, so we publish none: ask the host, and test your own site under load.
Critical insight: cached pages do not consume PHP workers. That is why a page cache (LiteSpeed Cache, WP Rocket or a host-native cache) is essential: it turns dynamic PHP requests into static HTML that skips the worker queue.
Plugin Impact on TTFB
Every Plugin Adds PHP Execution Time. Some Add More Than Others.
An earlier version of this page printed a 0-to-30 plugin progression. We have no record of that test, so it is gone. What follows is general guidance.
Plugins that run on every page load cost the most: SEO plugins that query post meta, security plugins with active scanning, analytics plugins that write to the database, and page builders that run several queries per page. Plugins that only run in the admin area or on specific pages have less effect on an anonymous visitor's TTFB. A slow CPU or a busy server makes every plugin's cost larger, which is another reason to judge a host with your real plugin set installed.
How to find your own heavy plugins: install Query Monitor, open the "Queries by Component" and "Hooks" views, and sort by time. Replace or remove anything that costs a lot on every page and that you do not need.
How to Speed Up Any WordPress Site (8 Steps, Server-Level First)
8 Steps. Server-Level First, Then Front-End.
General guidance, not measurements. The first three are server-level; the rest are front-end and code-level.
Upgrade PHP Version
Newer PHP releases generally run WordPress faster. Costs nothing; test first.
HIGH IMPACTEnable Object Cache (Redis)
Stops WordPress repeating the same database queries.
HIGH IMPACTFull-Page Cache
Cached pages skip PHP entirely: no workers used, no database queries.
HIGH IMPACTDatabase Optimization
Clear revisions, expired transients and orphaned metadata.
MEDIUM IMPACTImage Compression (WebP)
Images are usually most of a page's weight. Serve WebP and lazy-load.
MEDIUM IMPACTCDN
Helps international visitors on cacheable pages.
MEDIUM IMPACTPlugin Audit
Remove plugins you do not need; measure the rest.
MEDIUM IMPACTDNS TTL
A longer TTL on a stable site saves repeat DNS lookups.
MEDIUM IMPACT1. Upgrade Your PHP Version
Newer PHP releases generally run WordPress faster than old ones. Switch the version per site in your control panel, test for plugin compatibility on staging, then move. Check plugin compatibility first at php.watch. We did not benchmark versions against each other, so we give no percentage.
2. Enable Object Cache (Redis)
WordPress runs many database queries per uncached page. Object caching stores the results in memory so the database is not queried again for the same data. Some hosts include Redis and some charge for it, so check your plan.
3. Full-Page Cache
Cached pages skip PHP entirely: no workers used, no database queries, just stored HTML. On LiteSpeed hosts use the LiteSpeed Cache plugin; on NGINX hosts use the host's built-in page cache or a plugin such as WP Rocket. Most hosts cache correctly with little configuration once the matching plugin is installed.
4. Database Optimization
WordPress databases collect post revisions, expired transients, orphaned metadata and spam comments. A plugin such as WP-Optimize or Advanced DB Cleaner can clear them on a schedule. Back up first.
5. Image Compression (WebP + Lazy Loading)
Images are usually most of a page's weight. Use a plugin such as ShortPixel or Imagify for WebP, use the native loading="lazy" attribute on below-the-fold images, and set explicit width and height to prevent layout shift.
6. CDN
A CDN such as Cloudflare serves static assets and cached pages from locations near the visitor, which helps international visitors. It does not speed up uncached pages, which still go to your origin.
7. Plugin Audit
Every active plugin can add work on every page load. Install Query Monitor, look at the "Queries by Component" and "Hooks" views, sort by time, and remove or replace anything slow that you do not need. Delete rather than just deactivate.
8. DNS TTL
The TTL decides how long your domain's IP is cached. For a stable site a longer TTL means fewer repeat lookups. Before a planned migration, lower the TTL so the change propagates quickly, then raise it again.
These steps address the common causes of slow WordPress sites. PHP version, Redis, page cache, database, images, CDN, plugins and DNS. The first three are server-side. If they do not move your numbers, your host is likely the bottleneck, not your WordPress configuration.
What's Your Primary Need? Pick a Winner by Hosting Type
We have covered each use case above. Here is the 60-second version: for each common WordPress buyer profile, the plan that fits on our data, with the figures that back it and a link to the pick.
New site, speed-first, tight budget
The fastest shared plan we measured, on AMD EPYC 9354, with 0% errors across the load ramp. Renews at $19.95/mo.
Read the ChemiCloud review →Store that takes money, needs uncached speed
0% errors over the load ramp. We did not run a checkout test, so test your own store inside the money-back window.
See the load test →Managing several client sites, need flexibility
Five cloud providers listed on its site, pay as you go, no renewal step-up on the price record.
See Cloudways data →Real concurrent users, spike-prone
The plan that held up best at 100 concurrent clients. The shared plans we tested ranged from 210ms to 1240ms at the same step.
See load results →Best speed on a small budget
Compare the renewal price too: $19.95/mo after the first term.
See the price table →One high-revenue site, your time is the cost
PageSpeed Insights mobile score 93, the best in our set. Homepage lists 30 data centers.
See Kinsta data →Our Take: Three Things the Speed Data Keeps Telling Me
My Read on the WordPress Speed Benchmarks
Three opinions I will put my name to, each tied to a figure in our records on this page.
Our Pick: The Fastest WordPress Hosting in 2026
We benchmarked eleven plans with the same method: TTFB from 10 locations, a load ramp and an uptime window of 54 days. On those records ScalaHosting Entry Cloud was the fastest, and the plans on the slowest CPUs were the ones that struggled under load.
Here is the three-tier decision framework I would use today:
Tier 1: If you are serious about WordPress performance and can spend $24.95/mo or more
Get ScalaHosting Managed VPS. AMD EPYC 9474F (PassMark #42 of 5,999), 38ms origin TTFB, 58ms at 100 concurrent clients. $24.95/mo on a 36 months term, renewing at $39.95/mo. For a full breakdown of features, support and pricing, see our best WordPress hosting guide.
Best for: WooCommerce stores, business sites, agencies and any site where performance drives revenue.
Tier 2: If you are starting out or have a tight budget
Get ChemiCloud Pro at $2.95/mo on a 36 months term ($17.95/mo at renewal). AMD EPYC 9354, 78ms origin TTFB, 210ms at 100 clients, 0% errors. Shared hosting costs a fraction of Kinsta ($35.00/mo). Start here and move to a VPS when your traffic or revenue justifies it. Partner code MYFASTCLOUD applies on our link. See our cheap web hosting guide for alternatives.
Best for: new bloggers, small business sites and tight budgets, without WooCommerce traffic spikes.
Tier 3: If you are a developer or agency managing multiple client sites
Get Cloudways on Vultr High Frequency (from $16.00/mo). 48ms origin TTFB and 74ms at 100 clients. Five cloud providers listed on its site. The price record shows no renewal step-up. Partner code CLOUDS2022 applies on our link; terms are on the Cloudways promo page. See also our VPS hosting guide.
Best for: developers, agencies managing multiple sites and teams that want cloud flexibility.
What to Avoid (and Why)
- Bluehost Choice Plus, HostGator Business and GoDaddy Deluxe: on our records they failed 39.04%, 24.56% and 35.59% of requests across the load ramp and averaged 1240ms, 760ms and 950ms at 100 clients. ChemiCloud Pro finished with 0% errors.
- SiteGround GrowBig for a busy site: 780ms at 100 clients with 4% errors on our records, and a price that goes from $6.69/mo to $29.99/mo at renewal.
- Hostinger Premium for anything that makes money under load: 520ms at 100 clients with 0.8% errors on our records. It is fine for a small personal site.
Related Reading:
- Best WordPress Hosting: Full Features, Support and Pricing Comparison
- Fastest Web Hosting: Cross-Platform Speed Comparison
- Best VPS Hosting: When to Upgrade from Shared
- Best Unlimited Bandwidth VPS for High-Traffic Sites
- Best Dedicated Hosting for Enterprise Traffic
- Best Cheap Web Hosting
- Cloudways Promo Code

FAQ: WordPress Hosting Speed
What is the fastest WordPress hosting in 2026?
On our benchmark, ScalaHosting Entry Cloud: 38ms TTFB from New York to our test server with no CDN, 58ms average response at 100 concurrent clients and 0% errors over the full ramp. Cloudways on Vultr High Frequency was second at 48ms origin TTFB and 74ms at 100 clients, and Kinsta third at 64ms and 92ms. Among the shared plans ChemiCloud Pro was fastest at 78ms. Rocket.net measured 32ms at its CDN edge, which is a different measurement from origin TTFB and is not ranked against the others.
What is a good TTFB for WordPress?
Lower is better, and the figure only means something with its scope. As a rough guide, a few hundred milliseconds is common for uncached WordPress and slower than that is a server bottleneck no front-end tweak removes. On our benchmark, origin TTFB from New York with no CDN ran from 38ms (ScalaHosting) and 48ms (Cloudways) up to 344ms (GoDaddy). A cache or CDN can answer faster than the origin, so say which one you are comparing.
What is TTFB and why does it matter for WordPress?
TTFB (Time to First Byte) is the time between sending an HTTP request and receiving the first byte of the response. It reflects how fast the host runs PHP, queries the database and returns HTML, plus the network distance to the visitor. Google's Largest Contentful Paint starts counting at the same moment, so a slow TTFB leaves less time for the rest of the page. A cached page can skip PHP entirely and answer much faster than an uncached one.
What CPU does my WordPress host use and why does it matter?
WordPress runs PHP and database queries on the host's CPU, so a faster CPU helps uncached pages. From our CPU record: ScalaHosting runs AMD EPYC 9474F (PassMark #42 of 5,999), Kinsta AMD EPYC 7502 (#248), SiteGround Intel Xeon Gold 6248R (#432), WP Engine Intel Xeon Gold 6242R (#444) and Rocket.net Intel Xeon E5-2667 v2 (#1,543). Vultr documents its High Frequency servers (Cloudways) only as 3GHz+ Intel Xeon with no part number, so Cloudways carries no rank. PassMark ranks the chip, not your plan: the web server, caching and how crowded the server is matter too.
How do PHP workers affect WordPress speed?
PHP workers are the parallel processes that run WordPress code. When all are busy, new uncached requests queue, and a long queue ends in 503 errors or timeouts. Cached pages do not use a worker. We did not record worker counts for the plans on this page, so we do not publish them; ask a host for the number before you buy, because a plan with few workers will queue sooner under concurrent logged-in or checkout traffic.
LiteSpeed vs NGINX vs Apache for WordPress: which is fastest?
LiteSpeed's server-level cache and NGINX's FastCGI cache are both built for WordPress, and Apache without a cache plugin is usually the slowest of the three. We did not run a controlled web-server comparison, so we do not put a multiplier on it. What we can say from our records is how the plans performed, not why: ChemiCloud Pro (answering in 78ms origin TTFB) beat the Bluehost, GoDaddy and HostGator plans we tested (262ms, 344ms and 283ms).
What is object caching and how does it affect WordPress speed?
Object caching (usually Redis) keeps database query results in memory so WordPress does not repeat the same queries on every request. It helps most on pages a page cache cannot serve: WooCommerce carts and checkout, search and logged-in users. Whether a host includes it, or charges extra, changes by plan and over time, so check the plan's own feature list; we did not log add-on prices for this page.
What are the WordPress caching layers?
Browser cache (on the visitor's device), a CDN or edge cache (near the visitor), a full-page cache (the finished HTML, from a server-level cache or a plugin), an object cache such as Redis, and PHP OPcache. Each removes a different cost. A full-page cache or CDN can answer without running PHP at all, which is why our Rocket.net edge figure (32ms) cannot be compared with an origin figure.
Shared hosting vs VPS for WordPress speed: what is the actual difference?
Shared hosting divides one server's CPU, memory and workers among many sites; a VPS reserves a slice for you. In our load test the VPS and cloud plans held up best: ScalaHosting Entry Cloud averaged 58ms at 100 concurrent clients, against 210ms for ChemiCloud Pro, 780ms for SiteGround GrowBig and 1240ms for Bluehost Choice Plus. Over the whole ramp, SiteGround failed 4% of requests and Bluehost 39.04%. Good shared hosting can be enough for a small, steady blog; a revenue site with traffic spikes is safer on a VPS or managed platform.
Why is my WordPress site slow even with caching enabled?
Check that the cache is actually hitting (look for a cache HIT header in an incognito window), that something is not bypassing it on every URL parameter, and that the slow pages are not the ones caching cannot help: checkout, cart, search and logged-in screens still run PHP and the database, so a slow CPU or too few workers shows there. Caching helps anonymous visitors on cacheable pages and cannot fix slow dynamic requests.
What are Core Web Vitals and which WordPress hosts pass them?
Core Web Vitals are Largest Contentful Paint (LCP, good at 2.5 seconds or under), Interaction to Next Paint (INP) and Cumulative Layout Shift (CLS). Hosting mostly affects LCP, through TTFB. On our PageSpeed Insights mobile lab runs, LCP was 2.43s for ScalaHosting, 2.49s for Kinsta, 2.5s for Cloudways, 3.4s for SiteGround and 6.57s for GoDaddy. These are lab results on one test page, not field data, and we did not record INP.
Does server location affect WordPress TTFB?
Yes. Distance adds delay to every request a cache cannot answer. On our benchmark the same ScalaHosting server answered in 38ms from New York, 69ms from London and 143ms from Mumbai. Our test servers sat in New York (Frankfurt for Hostinger and SiteGround), so a city figure is the time from that city to our server, not to a data center near it. If most of your visitors are in one region, put the site there.
CDN vs hosting upgrade: which improves WordPress speed more?
They fix different problems. A CDN serves cached pages and static files from near the visitor but does little for dynamic requests such as checkout, search and logged-in users, which go to the origin. A faster host lowers origin TTFB for every request. Fix the host first if your uncached pages are slow, then add a CDN on top.
What PHP version is fastest for WordPress in 2026?
Run the newest PHP version your plugins and theme support, since newer PHP releases generally run WordPress faster than old ones. Switch per site in your control panel, test on staging first, and check plugin compatibility before moving. We did not benchmark PHP versions against each other, so we give no percentage.
What is the fastest WooCommerce hosting?
We did not run a WooCommerce checkout test, so we cannot name a checkout winner. The closest records we hold are the 100-client load result and the error rate over the ramp: ScalaHosting 58ms with 0% errors, Cloudways 74ms with 0%, Kinsta 92ms with 0%. Checkout pages cannot be cached, so choose a plan that holds up on uncached load and test your own store on a trial.
Can I run WordPress on shared hosting with 100,000 monthly visitors?
It depends on how the traffic arrives. Visits spread evenly over a month mean only a few visitors at a time, which good shared hosting can handle. A spike from social media or a news link can put many visitors on the site in one hour. In our load test ChemiCloud Pro averaged 210ms at 100 concurrent clients with 0% errors, while SiteGround GrowBig averaged 780ms with 4% failed requests. If spikes are likely, use a VPS or managed plan.
Why does WordPress.org recommend Bluehost if Bluehost is slow?
We cannot speak to WordPress.org's reasons, and we have not verified its commercial terms. What we can report is our own result: Bluehost Choice Plus answered in 262ms origin TTFB (New York to our test server) and averaged 1240ms at 100 concurrent clients, with 39.04% of requests failing over the load ramp. A recommendation list and a benchmark answer different questions, so judge a host on the test that matches your site.
What is the fastest shared WordPress hosting in 2026?
ChemiCloud Pro was the fastest shared plan we measured: 78ms origin TTFB, 210ms at 100 concurrent clients and 0% errors. Hostinger Premium measured 276ms from New York (its test server sat in Frankfurt, where we measured 109ms). The ChemiCloud Pro CPU is AMD EPYC 9354. Compare plans at the same scope: a shared plan measured from across an ocean looks slower than it is for nearby visitors.