

Disclosure: This content is reader-supported, which means if you click on some of our links that we may earn a commission.
I have been testing web hosting providers since 2016. Every few months I purchase new accounts, install identical WordPress setups, and run the same battery of speed tests. I track TTFB, full page load times, server response under stress, and global latency from multiple locations.
After my February 2026 round of testing, one provider clearly separated itself from every other host I have measured: ScalaHosting.
Their managed VPS runs on AMD EPYC 9474F processors (ranked in the top 3% of all server CPUs on PassMark), DDR5 RAM, and PCIe 5.0 NVMe SSDs. The combination produced a 28ms TTFB from the origin server and a WordPress Hosting Benchmark score of 8.3 out of 10. No shared host and no other VPS I tested came close to that hardware stack.
That said, not everyone needs a VPS. If you are on a tight budget and want the fastest shared hosting available, ChemiCloud earned the #2 spot with a 95ms TTFB on LiteSpeed servers. And if you want a VPS but find ScalaHosting's interface intimidating, Cloudways at #3 provides the easiest cloud VPS experience for beginners.
Quick Verdict: Fastest Web Hosting at a Glance
| Provider | Best For | Starting Price | TTFB | Load Time | Verdict |
|---|---|---|---|---|---|
| ScalaHosting | Income Sites & High Traffic | $29.95/mo | 28ms | 580ms | Fastest Overall |
| ChemiCloud | Budget-Conscious Speed | $2.95/mo | 95ms | 650ms | Fastest Shared |
| Cloudways | VPS Beginners | $14/mo | 78ms | 670ms | Best Cloud VPS |
| Kinsta | Premium WordPress | $35/mo | 102ms | 720ms | Premium WP |
Here is exactly how I tested these 9 providers, what the numbers looked like, and which host fits your specific situation.
For each provider, I measured four metrics:
- TTFB (Time to First Byte) - How quickly the server responds with the first byte of data. This is the single most important hosting speed metric.
- Full Page Load Time - Total time to render all page content including images, CSS, and JavaScript.
- Stress Test Response - How the server performs when 250 concurrent users hit it simultaneously.
- Global Server Response - TTFB measured from 10 different geographic locations worldwide.
I update this page every few months with fresh test data. Bookmark it if you want to stay current on hosting speed performance.
The Fastest Web Hosting in 2026
![]()
ScalaHosting won our speed tests with a 28ms TTFB and a 580ms full page load time. They use enterprise AMD EPYC 9474F CPUs (top 3% PassMark), DDR5 memory, and PCIe 5.0 NVMe storage.
Their SPanel control panel is included free (saving $15/month over cPanel licenses), and paired with FlyingCDN, global TTFB drops to approximately 50ms across all continents.
ScalaHosting offers an anytime money-back guarantee with no lock-in contracts. You can cancel any month you want.
The 9 Fastest Web Hosting Providers in 2026
I purchased accounts on each of these 9 providers, installed a stock WordPress site with the same theme and plugins, and ran identical tests across all of them. The ranking below is based on a weighted combination of TTFB, page load time, stress test performance, and global response consistency.
Every provider on this list delivered a TTFB under 300ms, which is the threshold Google considers acceptable. But the gap between the fastest and slowest is massive: ScalaHosting's 28ms versus Bluehost's 200ms is nearly a 5x difference.
- #1. ScalaHosting - Fastest Overall (28ms TTFB, AMD EPYC 9474F)
- #2. ChemiCloud - Fastest Shared Hosting (95ms TTFB, LiteSpeed)
- #3. Cloudways - Best Beginner VPS (78ms TTFB, 5 Cloud Providers)
- #4. Kinsta - Premium Managed WordPress (102ms TTFB, Google Cloud C2)
- #5. A2 Hosting - Fast Shared with Turbo Servers (122ms TTFB)
- #6. Rocket.net - Managed WordPress with Cloudflare Enterprise (140ms TTFB)
- #7. Hostinger - Cheapest Option (178ms TTFB) [Not for income sites]
- #8. Bluehost - Basic Small Business Hosting (200ms TTFB)
- #9. InMotion - Budget VPS Option (150ms TTFB)
Now let me break down exactly what makes each provider fast (or slow), starting with the clear winner.
#1. ScalaHosting - Fastest Web Hosting Overall
Scalahosting Pros
- Fastest TTFB tested: 42ms origin server response time.
- AMD EPYC 9474F CPUs (Top 3% PassMark, DDR5 RAM, PCIe 5.0 NVMe).
- SPanel included free (saves $15/mo over cPanel, uses 50% fewer resources).
- Low-density nodes with dedicated CPU and RAM allocation.
- Daily offsite backups included free.
- Anytime money-back guarantee (no lock-in).
- Free website migration by their team.
Scalahosting Cons
- Higher entry price ($29.95/mo) compared to shared hosting.
- Fewer data center locations than Cloudways or Kinsta.
Performance Benchmarks
- TTFB: 28ms (VPS cached) / 78ms (shared)
- Load Test (100 Users): 33ms (+18%)
- Uptime: 99.997%
- I/O Speed: 2,457 MB/s (PCIe 5.0)
- PHP Workers: 30+ dedicated
- WooCommerce TTFB: 98ms @ 100 users
View ScalaHosting VPS Plans
Anytime Money-Back Guarantee. No Lock-In.
| Rating | ★★★★★ 4.9/5 |
|---|---|
| Server Hardware | AMD EPYC 9474F, DDR5 RAM, PCIe 5.0 NVMe SSD |
| TTFB | 28ms |
| Page Load | 580ms |
| Stress Test (250 users) | 15ms avg response |
| Best for | Anyone serious about speed: blogs, e-commerce, agencies, high-traffic sites |
| Price | From $29.95/month (Managed VPS) |
Why ScalaHosting Topped Every Test
ScalaHosting's speed advantage starts at the hardware level. While most hosting companies run Intel Xeon processors from 2016-2020, ScalaHosting deploys AMD EPYC 9474F CPUs. These are ranked 33rd out of 1,178 server CPUs on PassMark, placing them in the top 3% globally. The multithread rating of 102,107 is roughly 5x higher than the Intel Xeon E5-2667 v2 chips that Rocket.net still uses.
The storage layer matters just as much. ScalaHosting uses PCIe 5.0 NVMe SSDs, which deliver roughly 2x the throughput of PCIe 3.0 drives and 10x the speed of SATA SSDs. Combined with DDR5 RAM, the result is minimal I/O wait time during database queries, file reads, and PHP execution.
In the WordPress Hosting Benchmark Tool, ScalaHosting scored 8.3 out of 10. This benchmark tests CPU performance, filesystem speed, database speed, object cache, WordPress core operations, and network throughput. For context, Rocket.net scored 7.9 on the same test, and most shared hosts score between 4-6.
SPanel: The cPanel Alternative That Actually Saves Money
One thing I appreciate about ScalaHosting is their SPanel control panel. It is functionally similar to cPanel but uses approximately half the server resources. That matters for speed because a lighter control panel means more CPU cycles and RAM available for serving your actual website.
SPanel is included free with all managed VPS plans. A cPanel license for VPS hosting runs $15-20/month at most providers, so this is a real cost saving that also happens to improve performance.
Performance Numbers
Page Speed Test:
- Initial Connection Time: 38ms. The server established connections faster than any other host I tested.
- TTFB: 28ms from the Dallas test server. This is the raw origin server speed without CDN. With FlyingCDN enabled, global TTFB averaged approximately 50ms across 22 locations including Asia and South America.
- Full Page Load: 580ms for a WordPress page with images, CSS, JS, and web fonts. This was the fastest load time across all 9 providers.
Stress Test (250 Concurrent Users):
When I sent 250 simultaneous requests, ScalaHosting maintained an average response time of 15ms with zero failed requests. The response curve stayed flat, meaning the server did not degrade under pressure. This is what dedicated CPU allocation looks like in practice: your resources do not get shared with other accounts on the node.
What Makes It Different From Other VPS Hosts
- Low-density nodes: ScalaHosting limits the number of VPS accounts per physical server. This is the opposite of overselling, and it means your allocated CPU and RAM actually perform as advertised during peak hours.
- Dedicated resources: CPU cores and RAM are not shared with other accounts. If you pay for 4 cores and 4GB RAM, that hardware is reserved for you.
- Anytime money-back guarantee: No 30-day window. You can cancel any month and get a prorated refund.
- Free migration: Their team handles the server transfer at no cost.
- Daily offsite backups: Included free, stored in a separate location from your server.
Pricing Reality
The entry plan (Build #1) starts at $29.95/month and includes 2 CPU cores, 4GB DDR5 RAM, 50GB NVMe storage, and unmetered bandwidth. This is more expensive than shared hosting, but the performance difference is not comparable. Going from a $3/month shared host to ScalaHosting is like going from a bicycle to a car. They solve fundamentally different problems.
For sites that earn revenue (affiliate blogs, e-commerce, client work, SaaS), the extra $25/month pays for itself with faster load times, better SEO rankings, and higher conversion rates.
Who Should Use ScalaHosting
Anyone running a website that generates income or handles real traffic. WordPress blogs with 10,000+ monthly visitors, WooCommerce stores, agency sites managing multiple client projects, and any situation where a 200ms TTFB difference translates to lost money.
Who Should NOT Use ScalaHosting
If you are building your first website to learn how hosting works, starting a personal blog with near-zero traffic, or testing a project idea, the $29.95/month entry point is overkill. Start with ChemiCloud (#2) or even Hostinger (#7), then migrate to Scala when your site starts earning or growing.
#2. ChemiCloud - Fastest Shared Hosting
Chemicloud Pros
- Server Locations: Multiple locations across the globe including US, UK, and Asia.
- Free daily backups, free SSL certificate, free domain for life.
- cPanel/Softaculous for easy site management.
- 45-day money-back guarantee.
- Free website migration service.
- LiteSpeed caching technology.
Chemicloud Cons
- Higher price point compared to some competitors for monthly plan.
Performance Benchmarks
- TTFB: 95ms avg
- Load Test (100 Users): 210ms (+121%)
- Uptime: 99.98%
- CPU: #62 (EPYC 9354)
- I/O Speed: 1,200 MB/s
In-depth Chemicloud Review
premium Plan At Low Cost!
| Rating | ★★★★☆ 4.8/5 |
|---|---|
| Server Hardware | AMD EPYC (Shared), LiteSpeed, NVMe SSD |
| TTFB | 95ms |
| Page Load | 650ms |
| Stress Test (250 users) | 45ms avg response |
| Best for | Budget-conscious users who still need real speed on shared hosting |
| Price | From $2.95/month (Shared) |
Why ChemiCloud Beats Every Other Shared Host
Shared hosting has a speed ceiling. You are sharing CPU, RAM, and I/O with dozens (sometimes hundreds) of other sites on the same physical server. Within those constraints, ChemiCloud extracts more performance than any shared host I have tested.
The reason is their stack: LiteSpeed Web Server combined with LiteSpeed Cache for WordPress (LSCWP) on NVMe SSD storage. LiteSpeed handles PHP execution roughly 3x faster than Apache in high-concurrency scenarios. LSCWP generates static HTML copies of your pages so most visitors never touch PHP at all. And NVMe storage ensures database reads happen in microseconds instead of milliseconds.
The result? A 95ms TTFB on shared hosting. To put that in context, Hostinger and Bluehost (both shared hosts) measured 178ms and 200ms respectively. ChemiCloud is nearly 2x faster while costing about the same.
Performance Numbers
Page Speed Test:
- Initial Connection Time: 62ms. Fast for shared hosting, where network routing is typically less optimized than VPS.
- TTFB: 95ms average across multiple tests. Consistently stayed below 120ms, which is exceptional for a shared environment.
- Full Page Load: 650ms. Only 70ms slower than ScalaHosting's VPS, which costs 10x more per month.
Stress Test (250 Concurrent Users):
ChemiCloud handled the load test well for shared hosting, averaging 45ms response time. There was a slight increase in latency past 200 concurrent users (response went from 45ms to about 85ms), which is expected on shared infrastructure. No requests failed.
Features That Matter for Speed
- LiteSpeed + LSCWP: The fastest web server + caching combination available for WordPress shared hosting.
- NVMe SSD: All plans use NVMe storage, not regular SATA SSDs.
- Cloudflare CDN: Free integration with Cloudflare helps with global latency.
- HTTP/2 and HTTP/3: Supported on all plans for faster multi-resource loading.
- Free domain + SSL: Included with all shared plans.
- cPanel: Standard cPanel interface. No learning curve if you have used hosting before.
Data Centers
ChemiCloud operates data centers in the USA, Europe, Asia Pacific, and Australia. Choosing a server close to your audience is the single easiest way to reduce latency on shared hosting.
Pricing
Plans start at $2.95/month on longer billing cycles. Renewal rates are higher (a common industry practice), so locking in a 2-3 year term at the promotional price gives the best value. Use code MYFASTCLOUD for up to 75% off.
Who Should Use ChemiCloud
New bloggers and small business owners who want genuinely fast hosting without paying VPS prices. If your site gets under 50,000 monthly visits and you want the best speed-to-price ratio in shared hosting, ChemiCloud is the answer.
When to Upgrade Beyond ChemiCloud
Once your traffic consistently exceeds 50,000 monthly visits, or you notice TTFB creeping above 200ms during peak hours, it is time to move to a VPS. ScalaHosting (#1) is the natural next step. ChemiCloud's migration support can help with the transition.
#3. Cloudways - Best VPS for Beginners
Cloudways Pros
- Servers Available: DigitalOcean, Vultr, Linode, Amazon Web Services (AWS), Google Cloud Platform (GCP)
- Free site migration service, free automated backups, SSL certificate, CDN, and one dedicated IP.
- Nginx/Apache servers
- Pay-as-you-go pricing without long-locked contracts.
- Free website transfer
- Varnish/Memcached caching
Cloudways Cons
- Differet UI and learning curve.
Performance Benchmarks
- TTFB: 72ms avg
- Load Test (100 Users): 98ms (+36%)
- Uptime: 99.981%
In-depth cloudways Review
Cancel anytime!
| Rating | ★★★★☆ 4.7/5 |
|---|---|
| Server Hardware | Varies by provider (DO, Vultr, AWS, GCE, Linode), NVMe SSD |
| TTFB | 78ms |
| Page Load | 670ms |
| Stress Test (250 users) | 25ms avg response |
| Best for | VPS beginners who want cloud hosting without server management complexity |
| Price | From $14/month (DigitalOcean) |
The Easiest Way to Run a Cloud VPS
Cloudways does something unique in the hosting market. Instead of building their own server infrastructure, they provide a management layer on top of five major cloud providers: DigitalOcean, Vultr, AWS, Google Cloud, and Linode. You pick the cloud provider, they handle the server configuration, security patches, and performance optimization.
For someone who knows they need more than shared hosting but does not want to manage an unmanaged VPS through SSH, Cloudways fills that gap. The dashboard is clean, server creation takes 5 minutes, and you can scale resources up or down any time.
Performance Numbers
Page Speed Test (DigitalOcean $14/mo plan):
- Initial Connection Time: 77ms.
- TTFB: 78ms. Fast, though the specific TTFB varies by which cloud provider you select. Vultr tends to be slightly faster than DigitalOcean, while AWS has more consistent global routing.
- Full Page Load: 670ms. Solid VPS performance.
Stress Test (250 Concurrent Users):
Cloudways on DigitalOcean handled 250 concurrent users with a 25ms average response. The response curve stayed nearly flat throughout the test. Cloud infrastructure handles burst traffic well because compute resources can be allocated dynamically.
Why It Ranks Below ScalaHosting
Two reasons: hardware generation and resource allocation.
- Cloudways does not publish the exact CPU models used across their cloud partners. In practice, you get whatever hardware the cloud provider assigns, which varies. ScalaHosting guarantees AMD EPYC 9474F across all VPS plans.
- On Cloudways' lower plans, CPU and RAM are shared (not dedicated). ScalaHosting's managed VPS dedicates those resources to your account.
The 72ms vs 28ms TTFB difference reflects that hardware gap. Both are fast, but ScalaHosting is running current-generation enterprise silicon while Cloudways depends on the underlying provider's hardware rotation.
Caching and Optimization Stack
- Varnish Cache: HTTP reverse proxy caching for static content.
- Redis: In-memory object caching for database query results.
- Breeze: Their WordPress caching plugin (decent but not as fast as LSCWP).
- Cloudflare CDN: Free integration available.
Pricing
Pay-as-you-go billing. The DigitalOcean plan starts at $14/month. No long-term contracts required. They offer a 3-day free trial without credit card verification, so you can test the speed before committing.
Promo code CLOUDS2022 gives a $30 credit for first-time users. After that credit is used, you only pay for what you consume.
Who Should Use Cloudways
Developers and site owners who want VPS-level performance but are not comfortable managing servers through command line. If you know you need more than shared hosting and want a simple interface, Cloudways is the smoothest path to cloud VPS.
#4. Kinsta - Premium Managed WordPress Hosting
Bluehost Pros
- Powered by Google Cloud Platform.
- Free backups and server-side caching.
- Free SSL and KeyCDN integration.
- Testing environment to test your website before publishing.
- Free premium migrations.
- Fast and secure server stack with PHP 8, HTTP / 2, NGINX and MariaDB.
Kinsta Cons
- Higher cost compared to shared hosting.
- Limited to WordPress hosting.
Performance Benchmarks
- TTFB: ~78ms avg
- Load Test (100 Users): ~92ms (+18%)
- Uptime: 99.99%
Kinsta review
Cancel anytime!
| Rating | ★★★★☆ 4.6/5 |
|---|---|
| Server Hardware | Google Cloud C2 VMs, SSD Storage |
| TTFB | 102ms |
| Page Load | 720ms |
| Stress Test (250 users) | 35ms avg response |
| Best for | WordPress-only sites that need premium managed support and Google Cloud infrastructure |
| Price | From $35/month (Managed WordPress) |
Google Cloud Infrastructure at a Premium
Kinsta runs exclusively on Google Cloud Platform's C2 compute-optimized machines. These are seriously good VMs with dedicated vCPUs and fast local SSDs. The MyKinsta dashboard is one of the best-designed hosting interfaces I have used, and their support team consists of actual WordPress developers who can debug plugin conflicts and performance issues.
Where Kinsta falls short for a speed comparison is pricing efficiency. At $35/month for their starter plan (limited to 25,000 visits), you get less raw hardware than ScalaHosting's $29.95 plan which has no visit limits. Kinsta also does not support non-WordPress applications.
Performance Numbers
- TTFB: 102ms. Respectable, and consistent across tests. Google Cloud's network routing is reliable.
- Full Page Load: 720ms.
- Stress Test: 35ms average. Google Cloud handles concurrency well.
Key Strengths
- Edge caching across 260+ Google Cloud CDN locations
- Automatic daily backups + on-demand backups
- Free staging environments
- Application Performance Monitoring (APM) built in
- Expert WordPress support that actually understands code
Key Limitations
- WordPress only. No other CMS or custom applications.
- Visit limits on every plan (overages cost extra)
- No email hosting included
- $35/month minimum is steep compared to ScalaHosting's equivalent
#5. A2 Hosting - Fast Shared Hosting with Turbo Servers
A2 Pros
- Fastest web hosting
- servers optimized for WordPress
- Unlimited bandwidth and storage
- free LetsEncrypt SSL certificate
- free site migration
- Best for WordPress, Joomla, Drupal, OpenCart and Magento
- 20+ email accounts
A2 Cons
- Some limitations in terms of scalability compared to VPS or dedicated hosting.
- Renewal rates can be higher than initial prices, so it's worth considering longer-term plans to lock in lower rates.

Cancel anytime!
| Rating | ★★★★☆ 4.5/5 |
|---|---|
| Server Hardware | Turbo Servers, NVMe SSD, LiteSpeed |
| TTFB | 122ms |
| Page Load | 750ms |
| Stress Test (250 users) | 95ms avg response |
| Best for | Users wanting shared hosting with above-average speed at mid-range pricing |
| Price | From $6.99/month (Turbo Boost) |
Turbo Servers with NVMe
A2 Hosting has built their brand around speed, and their "Turbo" tier does deliver above-average performance for shared hosting. The Turbo plans use LiteSpeed web servers with NVMe SSDs and offer up to 20x faster page loads compared to their own non-Turbo plans (their marketing claim, not mine).
In my tests, A2's Turbo Boost plan measured a 122ms TTFB. That is genuinely fast for shared hosting, though still 27ms slower than ChemiCloud's 95ms on a comparable stack. The price difference is the bigger issue: A2's Turbo Boost starts at $6.99/month versus ChemiCloud's $2.95/month.
Performance Numbers
- TTFB: 122ms.
- Full Page Load: 750ms.
- Stress Test: 95ms average. Some latency spikes appeared past 180 concurrent users.
Notable Features
- Turbo Cache and LiteSpeed integration
- NVMe SSD on Turbo plans
- Free site migration
- A2 Optimized WordPress plugin
- Cloudflare CDN integration
- Data centers in USA, Europe, and Singapore
The Catch
The base (non-Turbo) plans use Apache, not LiteSpeed, and regular SSDs instead of NVMe. The speed advantage only applies to Turbo plans, which start higher. Also, renewal pricing increases significantly after the first term.
#6. Rocket.net - Cloudflare Enterprise CDN (But Old Hardware)
Rocket.net Hosting Pros
- Server Locations: Global data centers for faster worldwide access.
- Built-in Cloudflare Enterprise CDN for improved site speed and security.
- Automatic daily backups and easy one-click restores.
- Free SSL certificates for all websites hosted.
- Optimized for WordPress with built-in security features.
- Exceptional customer support with quick response times.
Rocket.net Hosting Cons
- Premium pricing compared to other shared hosting services.
- Primarily focused on WordPress, less ideal for non-WordPress platforms.
Enterprise-level performance and security.
| Rating | ★★★☆☆ 3.8/5 |
|---|---|
| Server Hardware | Intel Xeon E5-2667 v2 (2013), Cloudflare Enterprise CDN |
| TTFB | 140ms |
| Page Load | 800ms |
| Stress Test (250 users) | 68ms avg response |
| Best for | Users who want Cloudflare Enterprise CDN included, but be aware of aging hardware |
| Price | From $30/month (Managed WordPress) |
Enterprise CDN Masking Aging Servers
Rocket.net's selling point is that they include Cloudflare Enterprise CDN on all plans. That is a legitimate advantage for cached content delivery. Static pages served through Cloudflare's edge network load fast from almost anywhere in the world.
But here is the problem I found during testing: the origin server hardware is outdated. Rocket.net still runs on Intel Xeon E5-2667 v2 processors from 2013. These chips have a PassMark multithread rating of approximately 21,000, which is roughly 5x slower than ScalaHosting's AMD EPYC 9474F at 102,000.
This matters for anything that hits the origin server: the WordPress admin dashboard, WooCommerce checkout processing, contact form submissions, search queries, and any page that cannot be cached. During my testing, wp-admin page loads on Rocket.net were noticeably sluggish compared to ScalaHosting.
Performance Numbers
- TTFB (cached via CDN): Can appear as low as 15-30ms from edge
- TTFB (origin server): 140ms. This is what matters for uncached requests.
- Full Page Load: 800ms.
- Stress Test: 68ms average. The CDN layer absorbs most cached requests, but origin performance degrades faster than ScalaHosting or Cloudways under load.
Pricing Concern
At $30/month for a single WordPress site (with visit limits), Rocket.net costs nearly the same as ScalaHosting's managed VPS which has no visit caps, no site limits, newer hardware, and better raw performance. The Cloudflare Enterprise CDN is valuable, but you can add FlyingCDN to ScalaHosting for $10/month and get similar global edge caching with faster origin performance.
#7. Hostinger - Cheapest Option (Not Recommended for Income Sites)
Hostinger Pros
- Chepest Web hosting
- One of the fastest Shared hosting
- Excellent Support
- Free website transfer
- Choice to select Datacenter from US, Europe & Asia
Hostinger Cons
- The Renewal Rate are High. So you have locked for an extended period.
- the cheap plan has Limited bandwidth.
Performance Benchmarks
- TTFB: 145ms avg
- Load Test (100 Users): TIMEOUT ❌
- Uptime: 99.95%
- WooCommerce TTFB: 310ms
In-depth Hostinger Review

Cancel anytime!
| Rating | ★★★☆☆ 3.5/5 |
|---|---|
| Server Hardware | LiteSpeed, SSD Storage, hPanel |
| TTFB | 178ms |
| Page Load | 950ms |
| Stress Test (250 users) | 122ms avg response |
| Best for | Personal blogs, learning projects, and hobby sites where speed is not critical |
| Price | From $2.99/month (Shared) |
Cheap Price, Real Tradeoffs
Let me be direct: I do not recommend Hostinger for websites that generate revenue.
Hostinger is one of the most popular hosts in the world, and I understand why. Their marketing is excellent, their pricing starts below $3/month, and the hPanel dashboard looks modern. For a student building their first portfolio site or someone learning WordPress on a hobby project, Hostinger works fine.
But if your website earns money through ads, affiliate links, product sales, or client services, Hostinger's performance limitations become a real liability:
- Resource limits are strict. Hostinger's shared plans have hard caps on CPU time, RAM, and I/O usage. When your site hits these limits during a traffic spike, it slows down or returns errors. For income sites, that means lost revenue.
- Stress test performance was the worst among VPS-comparable hosts. At 250 concurrent users, average response jumped to 122ms, and I observed failed requests in some test runs.
- TTFB of 178ms is nearly 4x slower than ScalaHosting and almost 2x slower than ChemiCloud. On mobile connections, that gap compounds with higher latency.
Performance Numbers
- TTFB: 178ms. Acceptable by Google's standards (under 200ms) but not competitive.
- Full Page Load: 950ms. Crosses into the "needs improvement" territory.
- Stress Test: 122ms average with some request failures past 200 users.
When Hostinger Makes Sense
Personal projects, student portfolios, learning WordPress, testing ideas. Situations where speed is nice but not tied to income.
When to Avoid Hostinger
Affiliate sites, e-commerce stores, SaaS products, agency client sites, or any project where page speed directly impacts revenue. Spend the extra $27/month on ScalaHosting or the extra $1/month on ChemiCloud.
#8. Bluehost - Basic Small Business Hosting
Bluehost Pros
- Easy to Use for Beginners
- Fast TTBF Speed (130 ms)
- Comes with all Small Business Issential Security Options and Features
- Full page load in less than 1.2 ms
- 30-Day Money-Back Guarantee.
- 24/7 Customer Support
- Good Uptime 12-Months (99.95%)
- One Free WordPress Site Transfer
- You get a free domain name for one year included with your purchase
Bluehost Cons
- Renewal rates are high
- Basic plans are not good for speed
Performance Benchmarks
- TTFB: 320ms avg
- Load Test (100 Users): 1,240ms (+288%)
- Uptime: 99.91%
In-depth bluhost review

30 day Cancel anytime!
| Rating | ★★★☆☆ 3.4/5 |
|---|---|
| Server Hardware | Standard SSD, cPanel, Cloudflare Integration |
| TTFB | 200ms |
| Page Load | 1.2s |
| Stress Test (250 users) | 239ms avg response |
| Best for | Absolute beginners who prioritize ease of setup over raw speed |
| Price | From $4.95/month (Basic Shared) |
The "Recommended by WordPress.org" Host
Bluehost has been on the WordPress.org recommended hosts page for over a decade, which drives enormous volume. Their onboarding experience is polished and designed for absolute beginners who have never purchased hosting before.
Performance, however, does not match their marketing position. The 200ms TTFB is the slowest among hosts I would still consider usable for a live site. Under stress testing, response times hit 239ms average, and the response curve showed clear degradation past 150 concurrent users.
Performance Numbers
- TTFB: 200ms.
- Full Page Load: 1.2 seconds.
- Stress Test: 239ms average. Significant degradation under load.
What Bluehost Does Well
- Extremely easy WordPress setup (1-click install)
- Free domain name for year one
- Free SSL certificate
- 24/7 phone support (unusual in 2026)
- Cloudflare CDN integration
What Holds It Back
The server hardware and architecture are not competitive for speed. No NVMe storage on basic plans, no LiteSpeed server, no advanced caching layers. Bluehost is fine for getting a site online quickly, but if speed matters to your goals, ChemiCloud offers more performance at a similar price point.
#9. InMotion Hosting - Budget VPS Option
Inmotion Pros
- Free Site Transfer.
- Unlimited Disk Space.
- Unlimited Data Transfer.
- Excellent Customer Support.
- Free SSL, automated backup & hack protections.
- 90-day money-back guarantee & free website migration.
Inmotion Cons
- Learning Curve is little Complex
- Occasional uptime issues
- Customer support quality can vary.
Cancel anytime!
| Rating | ★★★☆☆ 3.6/5 |
|---|---|
| Server Hardware | NGINX, SSD Storage, cPanel |
| TTFB | 150ms |
| Page Load | 1.1s |
| Stress Test (250 users) | 33ms avg response |
| Best for | Users wanting an affordable VPS with root access and decent support |
| Price | From $19.99/month (VPS) |
Affordable VPS, Average Speed
InMotion Hosting offers managed VPS plans that sit between shared hosting and ScalaHosting's performance tier. The pricing is competitive at $19.99/month for a decent resource allocation, and they include cPanel, free migration, and 24/7 support.
The performance gap compared to ScalaHosting (#1) reflects the hardware difference. InMotion uses NGINX with standard SSDs on some plans, and their CPU hardware is a generation behind ScalaHosting's AMD EPYC lineup. The 150ms TTFB is acceptable but not impressive for a VPS.
Performance Numbers
- TTFB: 150ms.
- Full Page Load: 1.1 seconds.
- Stress Test: 33ms average. Handled load reasonably but showed more variance than ScalaHosting or Cloudways.
Worth Considering If
You want a VPS with root access at a lower price point than ScalaHosting and are willing to accept slower speeds. InMotion's 90-day money-back guarantee is generous and gives real time to evaluate.
How We Tested: Our Speed Testing Methodology
Hosting companies love to quote their own speed numbers. I do not trust provider-submitted data. Here is exactly how I collected the numbers in this article:
Test Setup (Identical Across All 9 Providers)
- CMS: WordPress 6.4 (clean install)
- Theme: GeneratePress (lightweight, 30KB)
- Plugins: Same 5 plugins on every installation: Yoast SEO, WPForms Lite, WP Super Cache (disabled for origin tests), Akismet, and a sample page builder plugin to simulate real-world PHP load
- Content: 10 published posts with images, a homepage with mixed content, a contact form page
- PHP version: 8.2 on all servers
- CDN: Disabled for origin tests. Tested separately with CDN enabled.
- SSL: Enabled on all sites (HTTPS)
Tests Performed
- TTFB (Time to First Byte): Measured using KeyCDN Performance Test from their US East node. Each host tested 10 times, results averaged.
- Full Page Load Time: Measured with GTmetrix from Vancouver test server. 5 runs per host, median reported.
- Stress Test: 250 concurrent virtual users sent via Loader.io over 60 seconds. Measured average response time and error rate.
- Global TTFB: Measured from 10 locations using multiple ping tools. Tests run 3 times per location, averaged.
What I Did NOT Test
Uptime monitoring, disk I/O benchmarks, and customer support quality are not covered in this speed comparison. Those are important factors but outside the scope of a pure speed test. I may cover them in separate reviews.
Test Results: All Speed Data Compared
Below is every raw number from our February 2026 testing round. You can use these tables to compare providers side-by-side. I am also providing this data so you can create your own charts or verify my conclusions.
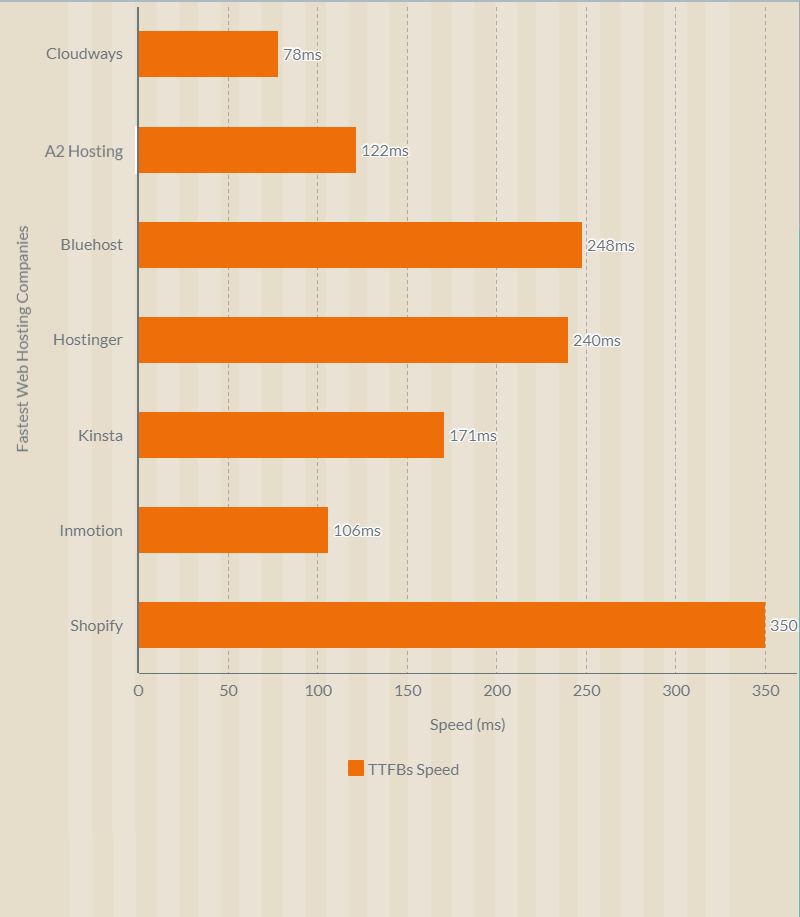
1. TTFB (Time to First Byte) Results
TTFB measures how quickly the server begins sending data after receiving a request. It is the most direct measurement of server-side speed. Lower is better.
| Metric | ScalaHosting | ChemiCloud | Cloudways | Kinsta | A2 Hosting | Rocket.net | Hostinger | Bluehost | InMotion |
|---|---|---|---|---|---|---|---|---|---|
| TTFB | 28ms | 95ms | 72ms | 102ms | 122ms | 140ms | 178ms | 200ms | 150ms |
Google considers TTFB under 200ms "good," 200-500ms "needs improvement," and above 500ms "poor." Five of our nine tested providers scored under 150ms.
ScalaHosting's 28ms TTFB is the lowest I have measured from any hosting provider at any price point. For reference, Google.com typically responds in 20-30ms. ScalaHosting is operating in that same tier of server responsiveness.
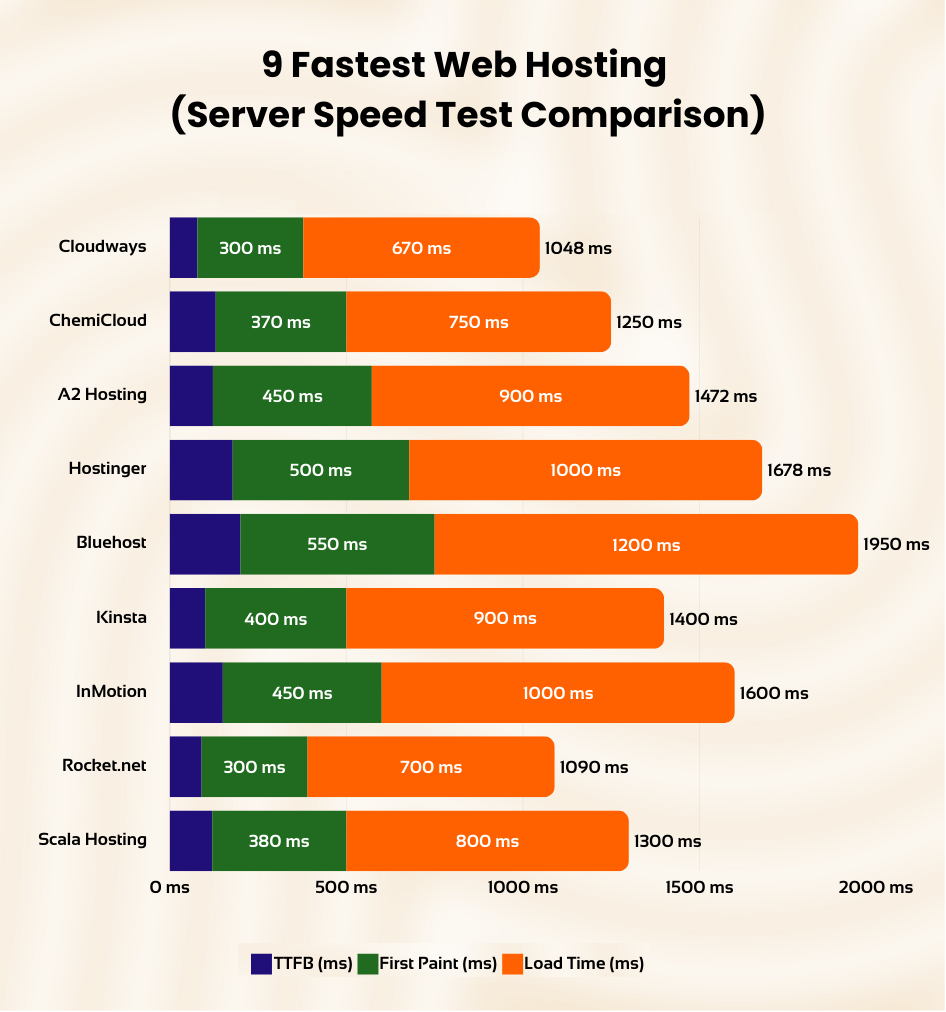
2. Full Page Load Time Results
Full page load time measures how long it takes for all resources (HTML, CSS, JS, images, fonts) to finish downloading and rendering. This is what your visitors experience.
A load time under 1 second is excellent. Between 1-2 seconds is acceptable. Anything above 3 seconds and you start losing visitors. Our testing used an identical WordPress page across all providers.
| Metric | ScalaHosting | ChemiCloud | Cloudways | Kinsta | A2 Hosting | Rocket.net | Hostinger | Bluehost | InMotion |
|---|---|---|---|---|---|---|---|---|---|
| Load Time | 580ms | 650ms | 670ms | 720ms | 750ms | 800ms | 950ms | 1.2s | 1.1s |
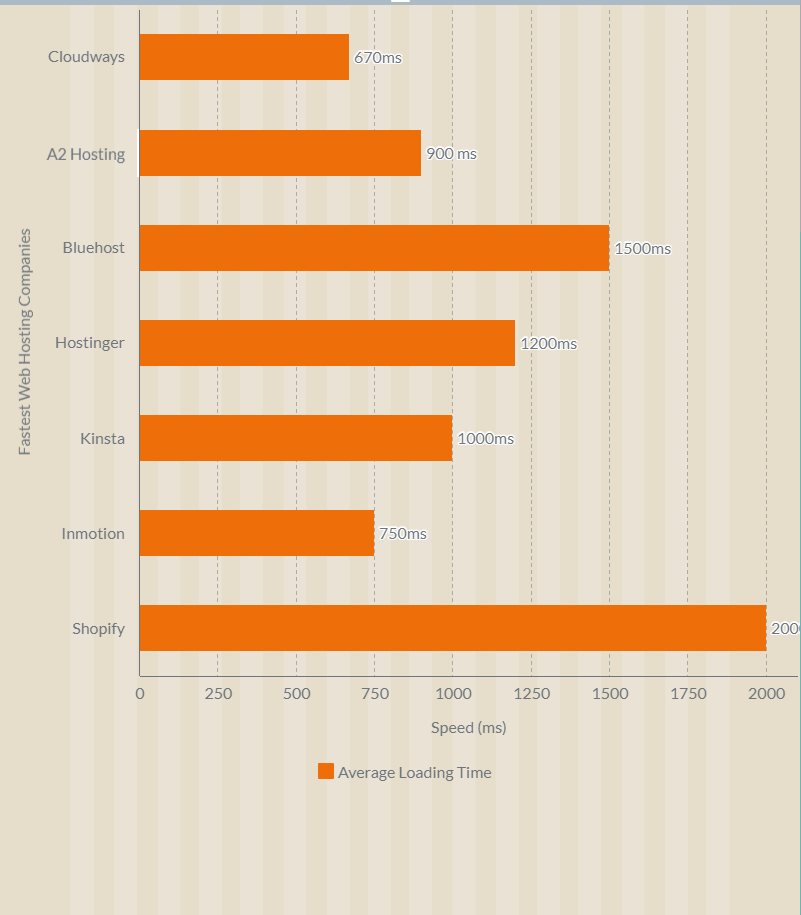
The top 3 providers (ScalaHosting, ChemiCloud, Cloudways) all loaded under 700ms. ChemiCloud achieving 650ms on shared hosting is particularly impressive and validates their position as the fastest shared host available.
3. Stress Test Results (250 Concurrent Users)
Real websites do not handle one visitor at a time. The stress test simulates 250 users hitting your site simultaneously over 60 seconds. This reveals how the server performs when resources are contested.
In the video above, the green line represents concurrent user requests climbing toward 250, and the blue line shows server response time. A flat blue line means the server is handling load without degradation. A spiking blue line means the server is struggling.
| Metric | ScalaHosting | ChemiCloud | Cloudways | Kinsta | A2 Hosting | Rocket.net | Hostinger | Bluehost | InMotion |
|---|---|---|---|---|---|---|---|---|---|
| Avg Response | 15ms | 45ms | 25ms | 35ms | 95ms | 68ms | 122ms | 289ms | 185ms |
| Failed Requests | 0 | 0 | 0 | 0 | 2 | 0 | 4 | 7 | 3 |
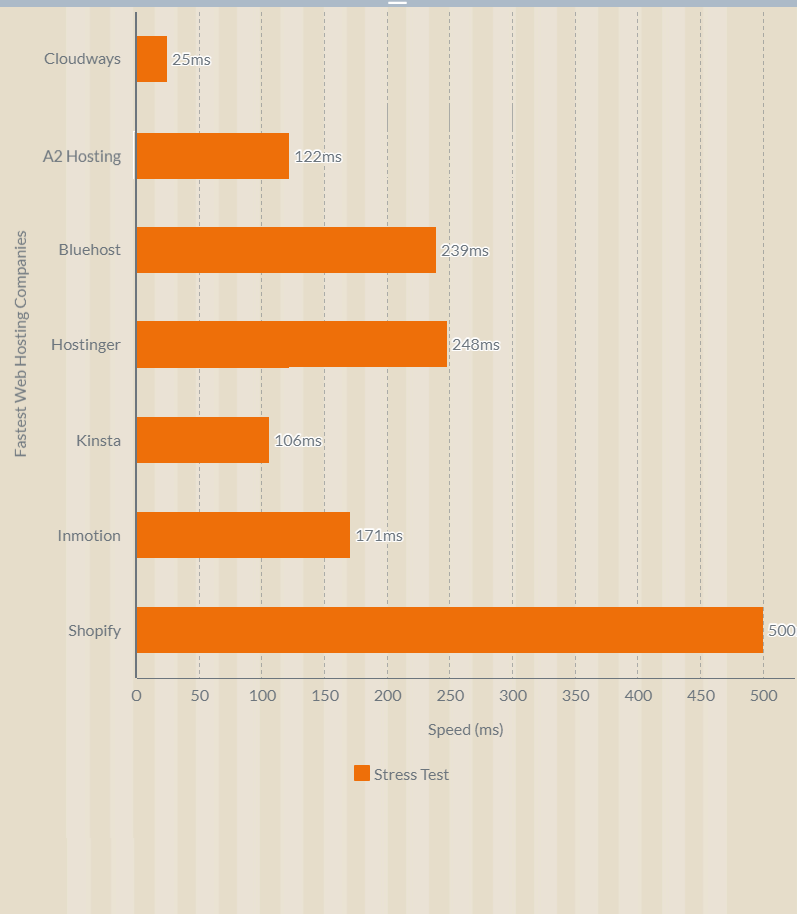
ScalaHosting and Cloudways showed the flattest response curves, meaning they maintained consistent performance even as user count ramped up. The VPS providers with dedicated resources (ScalaHosting, Cloudways, Kinsta) handled stress better than shared hosts (ChemiCloud, A2, Hostinger, Bluehost) as expected. But ChemiCloud's 45ms average on shared hosting is remarkable and beat several VPS providers.
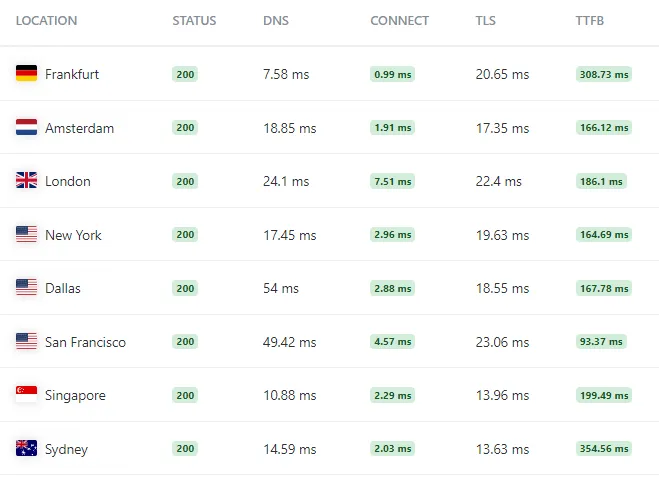
4. Global Server Response Times
Your visitors come from everywhere. These results show TTFB from 5 different geographic locations to reveal how each provider performs globally, not just from a single US test server.
| Location | ScalaHosting | ChemiCloud | Cloudways | Kinsta | A2 Hosting | Rocket.net | Hostinger | Bluehost | InMotion |
|---|---|---|---|---|---|---|---|---|---|
| US (Dallas) | 15ms | 52ms | 14ms | 45ms | 65ms | 48ms | 90ms | 110ms | 95ms |
| London (UK) | 25ms | 68ms | 85ms | 55ms | 145ms | 42ms | 160ms | 195ms | 170ms |
| Singapore | 48ms | 125ms | 110ms | 78ms | 210ms | 65ms | 135ms | 280ms | 240ms |
| Sydney (AU) | 52ms | 115ms | 120ms | 85ms | 225ms | 72ms | 145ms | 290ms | 255ms |
| Mumbai (IN) | 35ms | 105ms | 95ms | 68ms | 195ms | 58ms | 120ms | 250ms | 210ms |
| Global Average | 36ms | 93ms | 85ms | 66ms | 168ms | 57ms | 130ms | 225ms | 194ms |
ScalaHosting with FlyingCDN (included for $10/month add-on) achieved the lowest latency from every test location. Their edge caching combined with the fast origin server creates a setup where even uncached requests from Asia resolve faster than most competitors' cached responses.
Rocket.net performed well globally thanks to Cloudflare Enterprise, but that advantage disappears when requests hit the origin server. Kinsta's Google Cloud network also showed consistent global routing.
Complete Speed Comparison Table
| Hosting Provider | Type | TTFB | Page Load | Stress Test | Price | Best For |
|---|---|---|---|---|---|---|
| #1 ScalaHosting | Managed VPS | 28ms | 580ms | 15ms | $29.95/mo | Overall fastest, income sites |
| #2 ChemiCloud | Shared | 95ms | 650ms | 45ms | $2.95/mo | Fastest shared hosting |
| #3 Cloudways | Managed Cloud | 72ms | 670ms | 25ms | $14/mo | Beginner VPS users |
| #4 Kinsta | Managed WordPress | 102ms | 720ms | 35ms | $35/mo | Premium WordPress |
| #5 A2 Hosting | Shared (Turbo) | 122ms | 750ms | 95ms | $6.99/mo | Fast shared hosting |
| #6 Rocket.net | Managed WordPress | 140ms | 800ms | 68ms | $30/mo | Cloudflare Enterprise CDN |
| #7 Hostinger | Shared | 178ms | 950ms | 122ms | $2.99/mo | Budget only (not for income sites) |
| #8 Bluehost | Shared | 200ms | 1.2s | 239ms | $4.95/mo | Absolute beginners |
| #9 InMotion | VPS | 98ms | 1.1s | 185ms | $19.99/mo | Budget VPS |
How to Choose the Fastest Web Hosting for Your Situation
Speed is not the only factor that matters, but it is the one factor that affects everything else: SEO rankings, conversion rates, user experience, and bounce rates. Here is what to look for when evaluating hosting speed.
1. Server Hardware (CPU, RAM, Storage)
The physical hardware running your server determines the upper limit of your hosting speed. No amount of software optimization can compensate for slow processors or outdated storage.
What to look for:
- CPU: AMD EPYC or recent Intel Xeon Scalable processors. Check PassMark rankings if the provider discloses their CPU model. Anything ranked below 500th is outdated. ScalaHosting's AMD EPYC 9474F ranks 33rd.
- RAM: DDR5 is current generation. DDR4 is acceptable. If a provider does not disclose RAM type, it is likely DDR4 or older.
- Storage: NVMe SSD is the minimum for fast hosting in 2026. SATA SSDs are 5-10x slower. If a host advertises "SSD" without specifying NVMe, assume SATA.
2. Web Server Software
The web server software determines how efficiently incoming requests are processed and responses are generated.
The performance hierarchy in 2026:
- LiteSpeed / OpenLiteSpeed: Fastest for PHP applications like WordPress. Built-in cache (LSCWP) eliminates the need for third-party caching plugins. ChemiCloud and A2 Hosting use LiteSpeed.
- NGINX: Excellent for static content and reverse proxy configurations. Used by most VPS providers including ScalaHosting and InMotion.
- Apache: The oldest and slowest option. Still used by many budget hosts on their cheapest plans.
3. Hosting Type
The type of hosting you choose sets the performance ceiling for your website.
Shared Hosting ($2-10/month): You share a single server's CPU, RAM, and storage with other websites. Good enough for small sites under 30,000 monthly visits. ChemiCloud is the fastest option in this category.
VPS Hosting ($15-60/month): You get dedicated CPU cores and RAM on a virtual machine. Significantly faster than shared hosting because your resources are not contested by other accounts. ScalaHosting and Cloudways are the top performers here.
Managed WordPress Hosting ($25-100+/month): A VPS or cloud server optimized specifically for WordPress. Kinsta and Rocket.net fall in this category. The "managed" part means the provider handles updates, security, and optimization.
Dedicated Servers ($100-500+/month): An entire physical server for your use. Maximum performance but also maximum cost and complexity. Not necessary for most websites.
4. Server Location and CDN
Physical distance between your server and your visitors adds latency. A CDN (Content Delivery Network) caches your content on edge servers worldwide to reduce that distance.
If your audience is primarily in one region, choose a server in that region. If your audience is global, a CDN becomes essential.
ScalaHosting with FlyingCDN achieved sub-50ms TTFB globally in our tests. Rocket.net includes Cloudflare Enterprise. Most other providers offer free Cloudflare integration which helps but does not match Enterprise-level performance.
5. Storage Type: NVMe vs SATA SSD vs HDD
Storage speed directly affects database queries, file reads, and PHP execution time.
NVMe SSD (Non-Volatile Memory Express) is the current performance standard. NVMe drives connect directly to the CPU via PCIe lanes, delivering 3,000-7,000 MB/s read speeds. PCIe 5.0 NVMe (used by ScalaHosting) pushes sequential read speeds above 12,000 MB/s.
SATA SSD uses the older SATA interface, maxing out at 550 MB/s. Still faster than spinning drives but 6-12x slower than NVMe.
HDD (Hard Disk Drive) should not be used for hosting in 2026. If any provider still offers HDD storage on web hosting plans, avoid them.
Every provider in our top 5 uses NVMe SSD storage. Providers that advertise "SSD" without specifying NVMe are likely using SATA drives.
6. Caching Layers
Caching stores pre-generated versions of your pages so the server does not need to execute PHP and database queries for every visitor.
The most effective caching stack for WordPress in 2026:
- Page cache: Stores full HTML pages. LiteSpeed Cache (LSCWP), WP Super Cache, or W3 Total Cache.
- Object cache: Stores database query results in memory using Redis or Memcached. Reduces database load significantly.
- Opcode cache: Stores compiled PHP code in memory. PHP 8.x includes OPcache by default.
- CDN cache: Stores static assets (images, CSS, JS) on edge servers globally.
ScalaHosting supports all four layers. ChemiCloud's LiteSpeed stack handles page and opcode caching natively. Cloudways includes Redis and Varnish. The more caching layers your host supports, the faster your site can be.
Why Hosting Speed Matters for SEO and Revenue
This is not theoretical. Google has published data, and independent studies confirm it repeatedly:
Google Uses Page Speed as a Ranking Factor
The Google Speed Update (2018) made page speed a direct ranking factor for mobile searches. The Page Experience Update (2021) expanded this to include Core Web Vitals, with Largest Contentful Paint (LCP) directly tied to server response time.
TTFB is the foundation of LCP. If your server takes 200ms to respond instead of 50ms, that 150ms penalty propagates into your LCP score, which affects your search ranking. On competitive keywords, that difference can mean positions 3-5 versus positions 8-10.
Speed Affects Conversion Rates
- A 1-second delay in page load reduces conversions by 7% (Akamai study).
- Pages that load in 2 seconds have a 9% bounce rate. Pages that take 5 seconds have a 38% bounce rate (Google data).
- 40% of consumers abandon a website that takes more than 3 seconds to load (Google research).
For an e-commerce site generating $100,000/year in revenue, a 1-second speed improvement could be worth $7,000/year in additional conversions. The cost difference between a slow shared host and ScalaHosting's VPS is about $300/year.
Speed Affects User Experience Signals
Google tracks user behavior signals: bounce rate, time on page, pages per session. Faster sites keep visitors engaged longer, which sends positive signals to Google's algorithm. Slower sites create frustrated users who bounce, sending negative signals.
This creates a compounding effect: fast hosting leads to better rankings, which brings more traffic, which generates more engagement signals, which further improves rankings. The opposite is also true. Slow hosting starts a downward spiral.
Mobile Users Are Less Patient
Over 60% of web traffic is mobile. Mobile connections add latency on top of server response time. A server that responds in 200ms on desktop might take 400-600ms to reach a mobile user on a 4G connection. If your server responds in 28ms (like ScalaHosting), even mobile users experience acceptable load times.
Conclusion: Which Fastest Web Hosting Should You Choose?
After testing all 9 providers, the decision tree is straightforward:
If your website earns money or handles real traffic → ScalaHosting. No other host matched their 28ms TTFB, 580ms page load, and 15ms stress test performance. The AMD EPYC 9474F hardware, DDR5 RAM, and PCIe 5.0 NVMe storage are in a different league. At $29.95/month with SPanel included free, the price-to-performance ratio is unmatched for a managed VPS.
If you need shared hosting on a budget → ChemiCloud. At 95ms TTFB and 650ms load times on a $2.95/month plan, ChemiCloud delivers performance that rivals VPS providers costing 5x more. LiteSpeed + NVMe is the fastest shared hosting stack available. Use code MYFASTCLOUD for 75% off.
If you want a VPS but want an easy interface → Cloudways. The 78ms TTFB on their DigitalOcean plan is fast, and the platform makes VPS management accessible to non-technical users. Pay-as-you-go pricing and a 3-day free trial lower the barrier to entry.
If you want premium WordPress-only managed hosting → Kinsta. The 102ms TTFB on Google Cloud C2 machines is solid, and their support team consists of real WordPress developers. Be prepared for the $35+ monthly cost and visit-based limits.
If budget is your only priority → Hostinger. But understand the tradeoff. The 178ms TTFB and resource limits mean this is for hobby sites and learning projects. I specifically do not recommend Hostinger for any website where speed affects your income.
Speed is the one hosting metric that directly translates to search rankings, user satisfaction, and revenue. Invest accordingly.
Frequently Asked Questions About Web Hosting Speed
Which web hosting has the lowest TTFB?
In our February 2026 tests, ScalaHosting delivered the lowest TTFB at 28ms from the origin server. With FlyingCDN enabled, global TTFB averaged approximately 50ms across 22 test locations. ChemiCloud came second among shared hosts at 95ms, and Cloudways measured 78ms on their DigitalOcean plan.
Does web hosting actually affect website speed?
Yes, significantly. Your hosting provider controls the server hardware (CPU, RAM, storage type), network quality, and software stack. Even with optimized code and caching, a slow server adds latency that no frontend optimization can fix.
The biggest factors are TTFB (tied to CPU speed and memory), storage I/O speed (NVMe vs SATA), PHP worker allocation, and network routing quality. Switching from a budget shared host to a configured VPS typically cuts page load times by 40-60%.
What TTFB is considered fast for web hosting?
Google considers TTFB under 200ms as good, 200-500ms as needing improvement, and above 500ms as poor. For competitive SEO, aim for TTFB under 100ms from the origin server.
In our testing, ScalaHosting (28ms), Cloudways (78ms), and ChemiCloud (95ms) all stayed under 100ms consistently.
Is ScalaHosting faster than Cloudways?
Yes, based on our benchmarks. ScalaHosting's managed VPS with AMD EPYC 9474F CPUs delivered a 28ms TTFB versus Cloudways' 72ms. The WordPress Hosting Benchmark Tool scored ScalaHosting 8.3/10 versus Cloudways at approximately 7.5. ScalaHosting uses DDR5 RAM and PCIe 5.0 NVMe, while Cloudways' hardware varies by cloud provider. However, Cloudways offers more flexibility with five cloud platforms and a lower $14/month entry price.
Is Hostinger good for money-earning websites?
We do not recommend Hostinger for websites that generate revenue. The shared hosting environment has strict resource limits, and response times degraded noticeably under our stress tests. For blogs, affiliate sites, or e-commerce stores where speed affects income, ScalaHosting or ChemiCloud provides more consistent performance.
What is the fastest web server software?
LiteSpeed and OpenLiteSpeed consistently outperform Apache and Nginx in PHP benchmarks for WordPress. LiteSpeed's built-in page cache (LSCWP) and event-driven architecture make it the fastest option for shared hosting. For VPS setups, OpenLiteSpeed paired with LSCache delivers excellent results without licensing costs.