
Web Hosting Uptime Explained: What 99.9%, 99.99%, and 99.999% SLA Mean in Real Hours

Most hosting providers advertise 99.9% uptime. Most people accept that number without converting it. 99.9% uptime is 8.76 hours of downtime per year — which your host is contractually allowed to have. Before you evaluate any host's reliability, you need to know what the percentage actually means, whether the SLA covers the thing that matters, and why the uptime number in your control panel may have no relationship to what your visitors actually experience.
There is also a structural fact the hosting industry never discusses: a static or SSR site can survive an origin server failure entirely. A WooCommerce store with active shoppers cannot. If you are running a dynamic application, the resilience conversation is completely different from what most "uptime guide" posts describe. This page covers both tracks, gives you real monitoring data from hosts this site tests, and ends with a 10-point audit that tells you what your current setup can and cannot withstand.
What Uptime Actually Measures (And What It Does Not)
Your hosting provider's uptime guarantee covers exactly one thing: usually the server. Not your site.
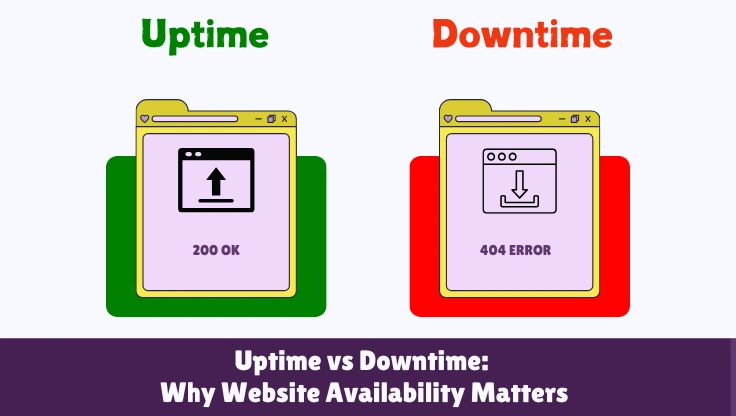
There are four distinct uptime types that get routinely conflated by hosts who have an incentive to report the most favorable number. Server uptime measures whether the operating system is running and the machine is reachable. Network uptime measures whether traffic can route to the server's IP address. Application uptime measures whether your site responds correctly to HTTP requests. User-perceived uptime measures whether visitors actually see a working page. A hosting provider can report 100% server uptime during a period when your WordPress site is completely inaccessible, and they are telling the technical truth.
Here is how all four fail independently. A PHP memory limit exhaustion takes your application offline while the server stays running. A database connection pool overflow returns 500 errors to every visitor while MySQL remains technically operational. A DNS misconfiguration routes traffic to a dead IP while the server at the new IP loads fine for direct requests. A Cloudflare edge node failure serves errors to European visitors while your Dallas-based monitor shows green. In every one of these scenarios, your host can credibly report 100% server uptime. Your visitors experience total downtime.
The SLA Exclusion Problem
Beyond the metric mismatch, most SLAs contain exclusions that can consume the majority of real outage time without triggering any compensation. Scheduled maintenance is commonly excluded. Security incidents that the host classifies as force majeure are excluded. Outages caused by "actions or inactions of the customer or third parties" can include anything from a plugin crash to a DDoS targeted at your domain specifically. Read the exclusion list in your host's SLA before you treat the percentage as a guarantee. The headline 99.9% number is what remains after subtracting everything the host will not compensate you for — and in many SLAs, what remains is a very narrow slice of the scenarios that actually cause real downtime.
The next section converts these percentages into numbers that are concrete enough to make real operational decisions.
SLA Math: Every Uptime Percentage Converted to Real Downtime
The percentage in a hosting SLA does not communicate anything useful on its own. "99.9%" is a number without a human unit. Converting it to hours and minutes is what makes it actionable — and the converted numbers are almost always worse than people expect.

| Uptime SLA | Daily Downtime | Monthly Downtime | Annual Downtime |
|---|---|---|---|
| 99% | ~14.4 min | ~7.3 hours | ~3.65 days (87.6 hours) |
| 99.5% | ~7.2 min | ~3.65 hours | ~43.8 hours |
| 99.9% | ~1.44 min | ~43.8 min | ~8.76 hours |
| 99.95% | ~43 sec | ~21.9 min | ~4.38 hours |
| 99.99% | ~8.6 sec | ~4.4 min | ~52.6 minutes |
| 99.999% | ~0.86 sec | ~26 sec | ~5.26 minutes |
The difference between 99.9% and 99.99% is the difference between almost nine hours per year and less than an hour. That gap is not closed by buying better hardware. It requires redundant architecture: load-balanced application servers, database replication, and automatic failover. Hardware alone cannot get you from 99.9% to 99.99% because the failure modes that consume the time between those two tiers are architectural, not physical.
What Each Tier Means in Plain Terms
| Uptime Level | Annual Downtime | What It Actually Looks Like |
|---|---|---|
| 99% | 3.65 days/year | One major outage every few weeks. Three and a half days of total downtime per year. Unacceptable for any production site. |
| 99.9% | 8.76 hours/year | One full Saturday afternoon offline per year. Still allows ~44 minutes of downtime per month. Industry standard for shared hosting. |
| 99.95% | 4.38 hours/year | About two full Sunday evenings per year. Better, but still visible to weekly visitors. |
| 99.99% | 52.6 min/year | Missing a lunch break per year. Tier this requires redundancy, not just reliable hardware. Enterprise-grade standard. |
| 99.999% | 5.26 min/year | Five minutes per year. Requires active-active architecture, database clustering, and real-time failover. Unreachable on shared or basic VPS. |
Embed This Table
This SLA reference table is free to use on your site with attribution. Copy the code below and paste it wherever you reference hosting SLAs. A link back to this page is the only requirement.
<!-- SLA Downtime Reference — Source: thatmy.com/uptime-downtime -->
<table>
  <thead>
    <tr><th>Uptime SLA</th><th>Monthly Downtime</th><th>Annual Downtime</th></tr>
  </thead>
  <tbody>
    <tr><td>99%</td><td>7.3 hours</td><td>3.65 days</td></tr>
    <tr><td>99.9%</td><td>43.8 min</td><td>8.76 hours</td></tr>
    <tr><td>99.99%</td><td>4.4 min</td><td>52.6 minutes</td></tr>
    <tr><td>99.999%</td><td>26 sec</td><td>5.26 minutes</td></tr>
  </tbody>
</table>
<p>Source: <a href="https://thatmy.com/uptime-downtime">thatmy.com/uptime-downtime</a></p>
The Compensation Math Is Even Worse
Most shared hosting SLAs compensate violations with account credit equal to the prorated hosting cost for the outage period. For a $10/month plan, one month of hosting is $0.33 per day. A 2-hour SLA violation entitles you to approximately $0.028. The SLA does not compensate for revenue lost during the outage, recovery time, the cost of emergency support, or the customers who left for a competitor. The SLA is a floor on quality guarantees. Its real use is comparing providers — a host offering 99.99% SLA with meaningful compensation is demonstrating infrastructure confidence. A host offering 99.9% SLA with credit-only compensation is offering very little.
What Uptime Looks Like in Practice: Data From Hosts We Actually Tested
SLA promises are not uptime data. Most uptime comparisons in the hosting industry quote SLA numbers because they are available and flattering. The following data comes from active monitoring this site runs on test installations, not from provider marketing materials. The methodology is disclosed below the data.

Performance consistently exceeds the 99.9% SLA. Both incidents were brief and outside peak traffic hours. ScalaHosting's SPanel environment with SShield active showed no security-related downtime during the test period.
Cloudways uptime is tied to the underlying cloud provider (DigitalOcean, AWS, or GCP). Provider-level incidents propagate here. The Cloudways-added layer (application management, backups, monitoring) adds no meaningful latency to this metric.
Consistently above the 99.9% SLA even on shared hosting. For a shared hosting provider, this is a strong result. The longer incidents correlated with scheduled maintenance windows that were not announced via email in advance.
Monitoring Methodology
All three test installations run WordPress with a standard plugin set (no custom code). Monitoring is conducted via BetterUptime with 30-second check intervals from probe locations in North America, Western Europe, and Asia Pacific. A response is counted as "down" when the HTTP status code is not 200 for three consecutive checks from at least two probe locations simultaneously (to filter single-location network anomalies). SSL errors are tracked separately and not included in the uptime percentage above.
For full review data including response time distributions and incident timelines, see the ScalaHosting review and the Cloudways review.
The Downtime Cost Calculator: What One Hour of Outage Actually Costs You
Most people treat downtime as an abstract reliability problem. It is a revenue and business problem with a specific dollar value. The calculation below makes that number concrete. It also shows the break-even point for upgrading to a higher-uptime hosting tier — which is often less than most site owners assume.
Downtime Cost Calculator
Enter your numbers to see the real cost of downtime at your current SLA tier.
Why the Break-Even Matters More Than the SLA
The break-even line in the calculator asks: if upgrading from 99.9% to 99.99% hosting costs an extra $X per month, how many hours of prevented downtime justifies that cost? For most ecommerce stores doing over $5,000/month in revenue, the break-even is reached at under two hours of prevented downtime per year — which is well within the gap between those two SLA tiers. The conversation about upgrading hosting is not "how much does better hosting cost?" It is "how much does staying on cheaper hosting cost when something goes wrong?"
I have seen this calculation change purchasing decisions more reliably than any performance benchmark. A store owner who thinks in terms of "my hosting costs $30/month, why would I pay $80?" thinks differently after calculating that one four-hour outage during their peak month costs more than a full year of the premium tier.
Static Sites Survive Outages. Dynamic Sites Do Not. Here Is Why.
This is the structural fact the hosting industry does not discuss: your uptime problem is not the same as your neighbor's uptime problem, and the difference is whether your site generates content dynamically on every request or serves pre-built files from a cache. The advice to "get better hosting" only addresses one of these two situations.

Consider what happens when an origin server fails. A static site built with a Jamstack framework and deployed to a CDN has no PHP process to crash. The CDN serves pre-built HTML files from edge nodes globally. When the origin goes down — for maintenance, for a hardware failure, for a brief DDoS — the CDN continues serving the last-built version of every page. Most visitors never see an error. Recovery for a static site during origin failure is essentially automatic.
Now put a WooCommerce store with active shoppers in the same scenario. The origin server hosts PHP-FPM workers that receive every request and execute WordPress to generate a response. When the origin fails, PHP stops. Dynamic page requests return 500 errors. Every cart session is invalidated. Checkout fails. The CDN cannot help because no cached version of a cart page exists — it is generated fresh for each session. The user experience degrades completely until the origin recovers.
The Middle Ground: Stale-While-Revalidate
Between "fully static" and "fully dynamic" is a technique called stale-while-revalidate that most WordPress sites can use for their most important pages. The mechanism: the CDN serves the last cached version of a page immediately (even if it is stale) while simultaneously making a background request to the origin to refresh the cache. If the origin is down, the CDN continues serving the stale version indefinitely rather than failing. Visitors see content that may be hours old. They do not see an error page.
This works for product pages, blog posts, category pages, and homepages. It does not work for cart, checkout, or any page with session-specific content. For WooCommerce stores, stale-while-revalidate on public-facing pages plus a graceful degradation message on dynamic pages (cart, checkout, account) during origin failure is the realistic resilience strategy below the cost threshold of full active-active architecture. The caching guide covers how to configure stale-while-revalidate headers for WordPress with Cloudflare and WP Rocket.
Static vs Dynamic Resilience Strategies Side by Side
| Strategy | For Static Sites | For Dynamic Sites | Implementation Cost |
|---|---|---|---|
| CDN edge caching | Full pages cached globally; origin failure invisible to most users | HTML pages are dynamic; CDN caches assets only unless APO or full-page cache is configured | Low — Cloudflare free tier |
| Stale-while-revalidate | Serves last cached version during origin failure automatically | Requires explicit cache headers + CDN configuration; WooCommerce carts cannot be stale-served | Medium — CDN cache rules |
| Read-only fallback mode | No concept needed — static is always read-only | Disable writes during failure; serve cached product pages; show maintenance banner on cart/checkout only | Medium — custom logic |
| Database replication | No database — not applicable | Primary/replica setup; replica serves reads during primary failure; writes queue until primary recovers | High — managed database service |
| Load balancing | CDN handles this by default across edge nodes | Two app servers behind a load balancer; session stored in Redis not server memory | High — requires load balancer service |
| Session persistence | No sessions — not applicable | Store sessions in Redis, not PHP files or local disk; Redis survives server restarts; sessions survive app server failure | Medium — Redis setup |
| Automatic failover | CDN handles this across edge PoPs automatically | DNS-based or load-balancer-based failover; database failover requires replication setup | High — requires HA infrastructure |
The practical takeaway for 2026: if you are building a new site and the content does not require per-user dynamic generation, build static or use SSR with aggressive edge caching. The uptime difference between a well-configured static site on a CDN and a dynamic WordPress site on shared hosting is not a matter of SLA tier — it is a matter of architecture. The CDN guide covers edge-first architecture in detail, including Cloudflare Workers for dynamic routes that need computation without origin round-trips.
Planned Maintenance vs Unplanned Outages: Two Different Operational Problems
They both result in your site being down. Everything else about them is different. Treating planned maintenance and unplanned outages as the same problem means applying the wrong fixes to both.
| Factor | Planned Maintenance | Unplanned Outage |
|---|---|---|
| Cause | Scheduled upgrade, migration, certificate renewal | Hardware failure, software crash, DDoS, config error, resource exhaustion |
| Control | Fully within provider or operator control | Partly or fully outside operator control |
| Advance notice | Usually announced; should be 24-72 hours minimum | None — first notice is often the monitoring alert |
| SLA impact | Often excluded from SLA downtime calculation (check ToS) | Typically counts against SLA if duration exceeds threshold |
| Mitigation | Schedule during low-traffic window, test in staging, communicate to users | Redundancy, automatic failover, backup restoration, incident response plan |
| Typical duration | 15 minutes to 4 hours | Seconds (flash crash) to hours (major hardware failure) |
| Who handles it | The team initiating the change | On-call engineer, provider support, or both |
The Scheduled Maintenance SLA Trap
Read the fine print. Most hosting SLAs explicitly exclude scheduled maintenance from the downtime calculation, and the definition of "scheduled" varies dramatically. Some hosts define it as any maintenance announced 24 hours in advance — by email, by a banner in the dashboard, or by a post on their status page. Others define it as any maintenance window defined in their standard maintenance policy, which may allow unlimited maintenance hours as long as they are in a defined window (often 2 AM to 6 AM local time for the host's datacenter, not your timezone).
I have seen hosting contracts where the scheduled maintenance exclusion effectively allowed 20+ hours per month to be taken offline without triggering any SLA credit. The 99.9% SLA guarantee was arithmetically possible to satisfy while the host ran nightly maintenance windows that consumed more time than the SLA allowed. Check specifically: does your host count scheduled maintenance toward SLA downtime, and is there a cap on how much scheduled maintenance they can run per month?
Mitigation Strategies Are Different for Each Type
For planned maintenance: request 48-hour advance notice in writing, ensure maintenance is scheduled during your lowest-traffic window (not your host's lowest-traffic window), ask for an estimated duration and a rollback plan, and communicate to your users if the maintenance affects a customer-facing product. For WooCommerce stores specifically, a pre-maintenance order freeze (close new orders 30 minutes before) and a post-maintenance reconciliation (check pending orders from the maintenance window) are standard operational steps.
For unplanned outages: redundancy, monitoring, and incident response plans are the mitigation. Unplanned outages cannot be prevented entirely — the goal is to detect them within seconds, respond within minutes, and restore within a tolerable window. The monitoring section covers detection. The high availability section covers architectural prevention.
The Five Root Causes of Downtime (And Which One Will Hit You)
Hardware failure is the cause hosting providers discuss in their marketing because it is the failure mode they control and prevent. It is also the least likely root cause of downtime for your specific site. The cause that will actually take your site offline this year is probably a configuration change or a resource limit, not a failed disk.

| Root Cause | Frequency (Approx.) | Typical Duration | Who Controls It | Prevention |
|---|---|---|---|---|
| 1 — Deployment / Config Error | ~35% of incidents | Minutes to hours | Site owner or developer | Staging environment, rollback capability, deployment checklists |
| 2 — Resource Exhaustion | ~30% of incidents | Minutes to hours | Site owner (traffic control), host (hardware limits) | Autoscaling, traffic limits, resource monitoring with alerts |
| 3 — Dependency Failure | ~18% of incidents | Minutes to hours (outside control) | Third-party provider (DNS, CDN, API) | Redundant DNS providers, CDN with multiple edge networks, fallback for external APIs |
| 4 — Hardware / Network Failure | ~12% of incidents | Minutes to days | Hosting provider | Provider-level redundancy, geographic failover, managed hosting with SLA |
| 5 — Security Incident | ~5% of incidents | Hours to days (if severe) | Site owner + host | WAF, DDoS mitigation, rate limiting, incident response plan, offsite backups |
Deployment and Config Errors: The Quiet Majority
The single most common cause of unplanned downtime for WordPress sites is a change that breaks something. A plugin update that conflicts with another plugin. A PHP version upgrade applied by the host that exposes a compatibility issue in an old plugin. A manual .htaccess edit with a syntax error. A wp-config.php change with an incorrect database credential. These are not dramatic failures — they are quiet, they happen during normal operations, and they are completely preventable with staging environments and deployment checklists.
After working across dozens of WordPress incidents, the pattern is almost always the same: a change was made, the site broke, nobody realized it immediately because they did not have monitoring configured, and the downtime stretched from minutes to hours because the person who made the change was not the person who first noticed the site was down. The fix — staging environments, deployment verification, and automated monitoring — costs almost nothing compared to a four-hour outage during peak traffic.
Resource Exhaustion: The Silent Killer
Resource exhaustion is the cause that looks like a different problem. Your PHP workers stop responding. Visitors see blank pages or server errors. The problem is not a bug — it is that you have run out of something: PHP memory limit, database connections, CPU time, concurrent processes. On shared hosting with CloudLinux LVE limits, resource exhaustion is enforced at the container level — your site gets throttled or stopped entirely when you exceed your allocation. This is not a host failure; it is your site outgrowing its hosting tier.
The monitoring signature of resource exhaustion is different from a crash: the site degrades progressively rather than going down all at once. Response times climb first, then errors appear on the most resource-intensive pages (cart, search, complex queries), then all pages fail. The correct response is not to restart services — it is to identify which resource was exhausted and either increase the limit or reduce consumption. The caching guide covers reducing resource consumption through caching; the database optimization guide covers expensive query patterns that exhaust database connections.
Dependency Failures: The Ones You Cannot Control
Modern WordPress sites depend on external services: the DNS provider, the CDN provider, payment gateway APIs, shipping rate APIs, email delivery services. Any of these failing takes parts of your site offline even when your server is perfectly healthy. A DNS provider outage means no visitors can reach your site at all. A CDN provider incident can degrade performance globally or take specific regions offline. A payment gateway failure makes checkout non-functional even though your server, database, and application are all running correctly.
The mitigation for dependency failures is redundancy at the dependency level: a secondary DNS provider with failover records, a CDN with multiple edge networks, fallback payment gateways. None of these are free, but the cost of a two-hour checkout failure during a peak sales period typically exceeds the annual cost of the redundancy that would have prevented it.
Why Your Uptime Monitor Is Lying to You (And How to Fix It)
Your monitoring dashboard says 99.97% uptime for the month. Your users report intermittent errors. Both are telling the truth. The discrepancy is not dishonesty — it is measurement gaps. Standard monitoring configurations miss more real downtime than they catch, and the failures they miss are often the most damaging to user experience.

The 1-Minute Check Gap
A monitoring tool that checks every 60 seconds has a 60-second blind spot after each check. An outage that starts 1 second after a successful check and recovers 59 seconds later is completely invisible in your monitoring history. This is not a pathological edge case. PHP worker crashes caused by memory spikes, database connection timeouts during burst traffic, and temporary overload conditions on shared hosting frequently last between 20 and 90 seconds. These are real failures experienced by real users. They appear as zero downtime in monthly reports because the monitor never catches them.
The fix: check every 30 seconds or faster. BetterUptime offers 30-second intervals on its free plan. Updown.io offers 15-second intervals on its pay-per-check model. The difference between 60-second and 30-second monitoring is catching roughly twice as many real short incidents. For most sites, moving from 1-minute to 30-second checks will reveal incidents that were previously invisible.
The Single-Location Lie
A monitoring probe from one location answers one question: can a request from Dallas reach your server? It does not answer: can users in Frankfurt, Singapore, or São Paulo reach your site? If your CDN is routing European traffic to a failed edge node, your Dallas monitor reports green. Your European users see 522 errors. This scenario is not hypothetical — Cloudflare, Fastly, and other CDN providers have had regional incidents where specific edge node clusters were degraded while the global network appeared healthy from a single probe location.
Multi-location monitoring is not optional for any site with international traffic. The minimum configuration: three probe locations on different continents. Configure consensus-based alerting — alert only when at least two locations agree the site is down. This eliminates the false positives caused by single-location network anomalies while catching the real geographic failures that single-location monitors miss entirely.
The HTTP 200 Is Not Enough Problem
A 200 OK response from your homepage means your server responded. It does not mean checkout works. It does not mean your payment gateway is connected. It does not mean search returns results. It does not mean your database is returning correct data rather than error pages that happen to return 200 OK. Standard HTTP monitoring catches server-level failures only.
Synthetic transaction monitoring tests the actual user flows: load the homepage, add a product to cart, proceed to checkout, verify the payment form loads. If any step in this sequence fails, the monitoring alerts immediately. This is the monitoring standard for any ecommerce site where a working server with a broken checkout still means zero revenue. BetterUptime and Pingdom Advanced both support synthetic transactions. For WordPress, a simple WP-CLI heartbeat endpoint that verifies database connectivity, cache layer status, and a sample query returns expected results is a minimal synthetic check you can build and monitor cheaply.
Monitoring Tools Compared: What Each One Misses
| Tool | Price | Min Interval | Probe Locations | What It Misses or Gets Wrong |
|---|---|---|---|---|
| UptimeRobot | Free / $7/mo Pro | 1 min (free), 30 sec (Pro) | 50+ global locations (Pro) | Free tier checks from one region; misses geographic outages; 1-min gap swallows flash crashes |
| Pingdom | $10/mo+ | 1 min | 70+ global locations | Premium pricing relative to features; 1-min minimum interval; good reporting but no synthetic transactions on base plan |
| BetterUptime | Free / $20/mo+ | 30 sec | 20+ locations | Best incident management workflow; on-call scheduling built in; synthetic transactions available; 30-sec interval catches more flash crashes |
| Hetrix Tools | $5/mo+ | 30 sec | 16+ locations | Strong value; good multi-location coverage; smaller probe network than Pingdom; blacklist monitoring included |
| Updown.io | Pay-per-check | 15 sec | 13+ locations | Fastest standard check interval; cheap for single-site use; smaller probe network; no synthetic transactions |
My recommendation for most WordPress and WooCommerce sites: BetterUptime free tier for primary monitoring (30-second interval, multi-location, with on-call scheduling for alerts) plus a lightweight synthetic transaction check via a custom endpoint. The free tier covers the critical gap between standard 1-minute single-location monitoring and what you actually need.
High Availability for Every Site Type: Static, WordPress, WooCommerce, and SaaS
High availability means different things depending on what your site does. The architecture for a static blog site to achieve 99.99% uptime costs almost nothing. The architecture for a WooCommerce store to achieve 99.99% uptime requires load balancers, database replication, session storage decoupling, and a managed failover system. These are genuinely different problems that require different solutions, and the same advice cannot apply to both.

Static and SSR Sites: Already Near HA by Default
A static site deployed to Cloudflare Pages, Netlify, or Vercel distributes pre-built HTML files across a global CDN network automatically. Every edge node holds a copy. If one node fails, traffic routes to the next closest. The origin — the build server or repository — is entirely removed from the request path. From an uptime perspective, these sites are already running a distributed, multi-node architecture. The practical ceiling is the CDN provider's global uptime, which for Cloudflare, Netlify, and Vercel consistently exceeds 99.99%.
The only additional resilience measure worth adding: configure Cloudflare's "Always Online" or equivalent feature to serve cached versions of any previously visited page during origin failures. For SSR sites that generate pages on-demand, add stale-while-revalidate Cache-Control headers so the CDN continues serving last-generated versions during origin downtime.
WordPress / Blog: Caching Is Your Resilience Layer
A WordPress site with a properly configured full-page cache operates much closer to a static site than most WordPress owners realize. When the page cache serves a request, PHP does not run. The database does not query. A full-page cache hit is served directly from disk or memory — the same mechanism as a static file. The resilience this provides: during brief PHP-FPM crashes, memory exhaustion events, or database overload conditions, cached pages continue to serve from the cache layer while the backend recovers.
The realistic resilience target for a WordPress blog or content site on a quality managed host is 99.95% or better, achievable without load balancers or database replication. The requirements are: full-page cache with Cloudflare or an equivalent CDN in front, a managed host with automated server monitoring and restart capabilities, daily backups with tested restore procedures, and BetterUptime monitoring with multi-location probes. ScalaHosting's managed VPS with SShield and Cloudways' managed cloud configuration both meet this standard. Moving from shared hosting to managed VPS is the single highest-impact reliability upgrade for a content WordPress site.
WooCommerce: The Database Failover Problem
Origin server redundancy for WooCommerce is a solved problem on managed cloud hosting. Cloudways, ScalaHosting, and similar providers can spin up a second application server in minutes and put a load balancer in front of both. The part that is not solved automatically is database failover. A WooCommerce store's orders, customers, products, and sessions all live in MySQL. If the primary MySQL server fails and there is no replica configured with automatic failover, the entire store fails — load-balanced app servers and all — because they cannot write or read orders.
The correct WooCommerce high availability configuration requires: (1) session and cart data stored in Redis rather than PHP session files or database rows, so sessions survive app server restarts; (2) a MySQL primary with at least one replica and automatic failover via ProxySQL or a managed database service; (3) a load balancer distributing traffic between at least two app servers; (4) WooCommerce order processing decoupled from the HTTP request via a queue (Redis Queue or similar) so a slow payment gateway call does not tie up PHP workers. The load balancing guide covers the application-layer configuration in detail.
SaaS and Dynamic Applications: Active-Active and Circuit Breakers
For applications where every request requires real-time data — user dashboards, real-time analytics, collaborative tools — the HA architecture is active-active: multiple application nodes all serving live traffic simultaneously, with a load balancer distributing requests and a shared database cluster handling writes. This is not a WordPress concern but a common question from site owners running custom PHP applications or hybrid WordPress-plus-custom-API setups.
The emerging 2026-era architecture for dynamic content resilience is edge compute: Cloudflare Workers and Durable Objects allow dynamic request handling at the CDN edge without an origin server in the traditional sense. A Durable Object can maintain session state, coordinate real-time interactions, and serve personalized responses without a round-trip to a central origin. For new dynamic applications where the content does not require a central database for every request, this edge-first model achieves near-static resilience for dynamic content. The CDN guide covers Cloudflare Workers and edge compute architecture.
Why 100% Uptime Is a Marketing Lie (And What to Ask Instead)
Several hosting providers claim 100% uptime. Some make this claim in their headline marketing copy. It is not achievable, and the providers who claim it are either redefining what "uptime" means or relying on contractual language that excludes nearly every real failure scenario from the SLA calculation.
Here is why 100% is physically unreachable. BGP routing updates that redirect traffic between networks take seconds to propagate — during that propagation window, some traffic reaches a new route while other traffic still follows the old one, causing intermittent failures for a brief period. DNS TTL propagation means that during any hostname change, some clients use the old address and some use the new one for the duration of the TTL period. Linux kernel updates require reboots. Hardware maintenance requires brief downtime even on hot-swap storage systems. TLS certificate renewals on misconfigured servers interrupt HTTPS traffic. The question is not whether downtime will happen; it is how much and whether the host can detect and recover from it faster than it takes to impact visitors.
The SLA Language That Makes 100% Claims Work
Hosts claiming 100% typically define "uptime" in their ToS as "network availability at the datacenter level" — meaning as long as traffic can reach the datacenter, their SLA is satisfied regardless of whether your application responds. They then exclude: scheduled maintenance (unlimited in some contracts), security incidents, third-party service failures, and anything where "customer action or inaction contributed to the outage." What is left after all exclusions is a narrow band of scenarios that a reliable datacenter almost never experiences anyway. The 100% claim is technically defensible and practically meaningless.
What to Ask Instead of "What Is Your Uptime Guarantee?"
Application uptime (your site actually responding) is the only metric that matters to your visitors. Network uptime (traffic reaching the datacenter) can be 100% while your site is completely inaccessible.
Quality hosts maintain a public status page with incident history. If a host cannot show you their last 90 days of incidents, they are either not tracking them or not publishing failures they should disclose.
Prorated account credit paid automatically is meaningfully better than prorated credit you must claim within 7 days. Both are far less valuable than a real refund. Know the compensation structure before a failure occurs.
Post-incident reports (PIR) are the highest trust signal a hosting provider can offer. They show the provider identified the root cause, fixed it, and implemented prevention measures. Providers that publish PIRs take reliability seriously. Providers that do not are hiding their failure modes.
The exclusion list defines the real SLA. A contract with a 99.9% SLA and broad exclusions may deliver less protection than a 99.5% SLA with narrow exclusions and clear compensation terms.
How to Evaluate a Host's Real Uptime (Including the ToS Red Flags to Check)
The difference between a host that will reliably keep your site online and one that will not is often visible in the Terms of Service before you sign up. These are the five clauses that separate real uptime commitments from marketing copy.
If the SLA definition does not include application-level availability, it covers a metric that almost never fails on modern hosting infrastructure. This SLA provides essentially no protection for the failures that actually affect your visitors.
Account credit locks you into a provider that has already failed you. Cash refunds or real service credits applied against future invoices are meaningfully more valuable. For a $10/month plan, the difference in dollar terms is small — but the principle matters when evaluating more expensive plans.
Any scheduled maintenance exclusion should come with: minimum 24-hour advance notice requirement, a cap on monthly scheduled maintenance hours, and a clear definition of what counts as "scheduled" versus "emergency maintenance."
A public status page with incident history is the minimum transparency standard for a hosting provider. Without it, you have no way to verify their uptime claims and no independent record of past failures. Find the status page before signing up. If one does not exist, treat that as a hard disqualifier.
"We make best efforts to maintain 99.9% uptime" is not a guarantee. It is a statement of intent with no compensation mechanism and no enforcement. Any SLA clause containing "best effort," "commercially reasonable efforts," or similar language is marketing text, not a contractual commitment.
Third-Party Verification Sources
Beyond the ToS, these sources give you independent evidence of a host's actual reliability. Downdetector shows community-reported outages that correlate with real incidents. Google search for the host name plus "down" or "outage" with a date filter shows recent incidents. Review platforms like Trustpilot and Hosting Advice show patterns of reliability complaints. The host's own status page incident history (look for the archive, not just current status) shows how often and how long they have failed in the past. A host with a public incident history showing 3 incidents per year, each under 30 minutes, is demonstrably more reliable than a host with no public history at all.
For verified uptime data from hosts this site has tested directly, the reviews for top-performing hosts include 90-day monitored uptime figures from independent monitoring, not from the hosts themselves.
Your 10-Point Uptime Audit Checklist
Work through this before you commit to any hosting provider and repeat it every time you renew or upgrade. Most reliability problems are identifiable before they happen — if you know where to look.

Find the SLA section in your host's Terms of Service. Locate the exact definition of "uptime." If it references network availability or datacenter connectivity rather than application response, the SLA covers the wrong metric. Application uptime is the standard to demand.
If excluded, check for: advance notice requirements (minimum 24 hours), monthly hour caps, and whether maintenance is distinguishable from unplanned outages in the incident history. No notice requirement plus no hour cap is a Red Flag 3.
Account credit, cash refund, or prorated service credit all have different values. The claim window (often 7 to 30 days after the incident) determines whether you can realistically collect. Find both before a failure occurs.
Most quality hosts maintain status pages at status.[hostname].com. Look at the incident history tab, not just the current status. Count incidents and note average resolution time. No public status page = Red Flag 4.
Use BetterUptime free tier (30-second interval, multi-location) or UptimeRobot Pro. Configure alert contacts for your mobile phone. Do this today — monitoring you set up after an incident is monitoring that has already failed you.
Add a temporary firewall rule blocking all HTTP/HTTPS traffic from outside your server, wait 2 minutes, then remove it. If your monitoring tool does not alert you, the interval or probe configuration is wrong. Fix it before a real incident.
Map every external dependency your site has: DNS, CDN, payment gateway, email service, external APIs. For each one, answer: what happens to your site if this fails? If the answer is "site goes down completely," that is a single point of failure that may warrant a backup provider.
For WooCommerce: configure Cloudflare's "Always Online" or page cache to serve product pages during origin failure. Ensure cart and checkout show a clear maintenance message rather than a broken page or 500 error during origin downtime.
A backup you have never restored is a backup of unknown quality. Run a restore to a staging environment, verify the site loads correctly from the restored data, and note how long the process took. The backup and restore guide covers the restore procedure in detail. For WooCommerce, verify that orders from the last 24 hours before the restore point are recoverable.
If one hour of downtime costs your business more than one year of a hosting upgrade, the economic case for the upgrade is complete. Use the calculator in Section 4 with your real revenue numbers and compare the annual downtime cost at your current SLA tier versus the next tier up. Most ecommerce stores with monthly revenue above $3,000 will find the upgrade pays for itself in prevented downtime within the first incident.
After completing this audit, you will know exactly what your current setup can and cannot withstand. Most sites fail items 5 through 8 before any incident occurs. The goal is not to have perfect infrastructure — it is to know where your gaps are so you can make informed decisions about which ones to close and which ones to accept as tolerable risk.
Uptime and Downtime FAQ
What is a good uptime percentage for web hosting?
For most websites, 99.9% is the minimum acceptable standard. This allows approximately 8.76 hours of downtime per year or 43 minutes per month. For ecommerce stores or any site where every hour of downtime has a direct revenue cost, 99.95% or better is the realistic target. That translates to under 4.4 hours of total downtime per year. For enterprise-grade applications processing payments or running real-time services, 99.99% (52 minutes per year) is the standard. On shared hosting, anything above 99.9% is typically marketing unless the host shows verified monitoring data. Managed VPS and cloud hosting plans from ScalaHosting, Cloudways, and similar providers can realistically achieve 99.95% or better with proper configuration.
Does 99.9% uptime mean my site will never go down?
No. 99.9% uptime means your site is permitted to be down for approximately 8.76 hours per year under the SLA. That is not a ceiling — it is an allowance. Most hosts consistently deliver better than their SLA, but the SLA defines the minimum they are contractually obligated to maintain and what compensation you receive if they fail. The 8.76 hours per year can come all at once (one long outage) or spread across dozens of short incidents. A single 8-hour outage during a major sale is technically within a 99.9% SLA, and the host owes you only the credit defined in their ToS, which is often worth less than one month of hosting fees.
How do I check my website's real uptime history?
Your hosting provider's own dashboard uptime reports should not be your primary source, because they may measure server availability rather than application availability. The most reliable approach is independent third-party monitoring. Set up a free UptimeRobot account (free tier checks every 5 minutes) or BetterUptime (free tier with 30-second checks) and point it at your site. Both tools show historical uptime reports going back 30 to 90 days. For a more complete picture, check your host's public status page (most quality hosts have one at status.hostname.com) and look at their incident history. If your host does not have a public status page, treat that as a red flag. You can also search for your host name plus 'down' or 'outage' on Downdetector to find community-reported incidents that hosts often do not self-report.
What is the difference between server uptime and website uptime?
Server uptime measures whether the physical or virtual machine is running and reachable. Website uptime measures whether a real user can successfully load your site. These are different things and hosts often report only the first. A server can have 100% uptime while your website is completely inaccessible due to: a PHP memory limit crash (the server is running; PHP is not), a MySQL connection failure (the server is up; the database is refusing connections), a misconfigured .htaccess (the server is responding with 500 errors), or a WordPress plugin conflict (the server returns pages, but they are error pages). When you read a host's uptime guarantee, find out whether it covers server uptime, network uptime, or application uptime. Application uptime is the only one that matters to your visitors.
Can a CDN keep my site online during server downtime?
For static content and fully cached pages, yes. If your CDN has a cached copy of a page and your origin server goes down, most CDN configurations will serve the stale cached version to visitors rather than returning an error. Cloudflare calls this 'Always Online' mode. For dynamic sites, the answer is more nuanced. Product pages and blog posts that are cached at the CDN can be served from cache during origin failure. Cart pages, checkout, account pages, and any URL that bypasses CDN cache cannot. WooCommerce stores with active shoppers will see failures on dynamic requests even if 80% of their traffic (uncached product browsing) remains served from cache. The critical insight is that a CDN is a resilience multiplier for the cacheable fraction of your traffic, not a replacement for server reliability.
Do hosting SLA guarantees actually pay out when violated?
Rarely, and the payout is usually far less than the damage. Most hosting SLA compensation is: (1) prorated account credit, not a cash refund, (2) only applicable if you file a claim within a specific window (often 7 to 30 days), (3) only applicable if the downtime is verified by the host's own monitoring, not yours, and (4) only for downtime exceeding a minimum threshold (often 0.1% or more). For a $10/month shared hosting plan, a 2-hour outage at 99.9% SLA might entitle you to roughly $0.28 in account credit. The SLA is a liability cap, not a performance guarantee. Its real value is as a selection signal: hosts willing to commit to 99.99% with meaningful compensation are indicating real confidence in their infrastructure. Hosts offering 99.9% with credit-only compensation are offering almost nothing.
Why does my monitoring tool show different uptime than my host reports?
Several reasons. First, your host may report server uptime while your monitoring tool measures HTTP response success — these are different metrics. Second, check interval differences matter enormously: a 5-minute monitoring interval misses any outage shorter than 5 minutes, while your host may be measuring availability at 1-second resolution. Third, geographic discrepancy: your monitoring tool checks from one or two locations, while your host monitors their own infrastructure. If Cloudflare routes traffic from your region to a failed edge node, your monitor may see green while your actual users see errors. Fourth, some hosts exclude scheduled maintenance from their uptime calculation. When you see a discrepancy, the correct response is to add monitoring from multiple locations with a shorter interval, not to trust the host's number.
How much revenue does one hour of downtime actually cost?
For an ecommerce store, the formula is: (monthly revenue / total monthly hours) × conversion rate impact. A store doing $30,000/month earns approximately $42 per hour on average. But downtime does not affect all hours equally — a 1-hour outage during peak traffic on a Saturday afternoon could eliminate 3 to 5 times the average hourly revenue. Add recovery time (the period after restoration when traffic is below normal as users retry), reputation cost (customers who never return after encountering a broken checkout), and SEO impact (Googlebot recording repeated crawl errors during downtime windows). For lead generation sites, calculate cost per lead times the number of leads typically generated per hour. For SaaS products, include churn risk from the most recently affected users. The Downtime Cost Calculator in Section 4 of this page automates this calculation for your specific numbers.
Is scheduled maintenance counted as downtime in SLA calculations?
It depends entirely on your host's ToS. Many hosting providers explicitly exclude scheduled maintenance windows from SLA downtime calculations, and the definition of 'scheduled' can be as loose as 'announced 24 hours in advance by email.' Read your host's SLA section in their Terms of Service specifically for the phrase 'scheduled maintenance' or 'maintenance window.' If scheduled maintenance is excluded with no advance notice requirement defined, a provider can technically schedule maintenance windows as frequently as they want. Quality hosts exclude scheduled maintenance only for windows that are announced in advance with a specific time window, kept to a reasonable total per month, and clearly distinguished from unplanned outages in their public incident history.
What causes more downtime: hardware failure or software bugs?
Software and configuration errors cause significantly more downtime in practice, even though hardware failure is the cause hosting providers discuss most. A 2019 Gartner analysis of data center incidents found that human error and software misconfiguration accounted for approximately 70% of unplanned downtime. For WordPress sites specifically, the causes are even more skewed toward software: plugin conflicts after updates, PHP version mismatches after host-side upgrades, memory limit exhaustion from traffic spikes, database connection pool exhaustion, and deployment errors from incorrect file uploads. Hardware failure does happen, but modern hosting infrastructure is designed with physical redundancy that absorbs most hardware failures without visible downtime. The failure that takes your site offline for hours is almost always a software, configuration, or dependency issue, not a broken disk.
Can WordPress sites achieve 99.99% uptime on shared hosting?
No. 99.99% uptime requires infrastructure that shared hosting architecturally cannot provide. Achieving 99.99% requires: load-balanced application servers (shared hosting puts your site on one server), database replication with automatic failover (shared hosting uses shared MySQL with no replica), zero-downtime deployment pipelines, and automated failover from failed components. Shared hosting by design puts hundreds of sites on one server. When that server goes down for maintenance, upgrade, or hardware failure, all sites on it go down simultaneously. The host's SLA for shared hosting is typically 99.9%, and the actual measured uptime over any 12-month period on any shared hosting provider will show multiple incidents totaling several hours. For 99.99% uptime on a WordPress site, you need a managed VPS or cloud hosting configuration with explicit redundancy, not shared hosting.
What is the fastest way to recover from unexpected downtime?
The fastest recovery is always to a known-good state, which means having a recent verified backup and a documented restore process before the incident starts. The sequence that works: (1) Identify the failure type — is the server down, is the application down, is the database down? These have different fixes. (2) If the server is unreachable, contact hosting support immediately and in parallel check your host's status page to see if it is a provider-wide incident. (3) If the application is down but the server is running, check PHP error logs and the WordPress debug log — most crashes leave a clear error message. (4) If the database is the issue, verify MySQL is running and check connection settings in wp-config.php. (5) If restoration is needed, restore from the most recent backup to a staging environment first, verify it works, then restore to production. A restore you have never tested takes 3 to 5 times longer than one you have practiced. The most important recovery preparation is a quarterly restore drill before the incident, not after.